


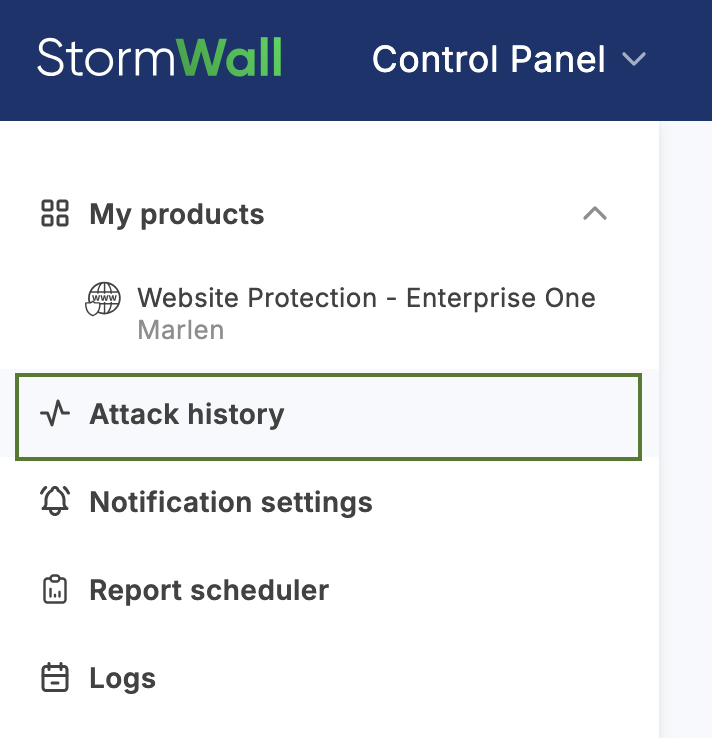
In the left-hand menu, select Attack history.
On the page that opens, attacks are listed for a time range that you can adjust.
Please note that the start and end times of attacks are displayed according to the time zone set in your Client Portal.
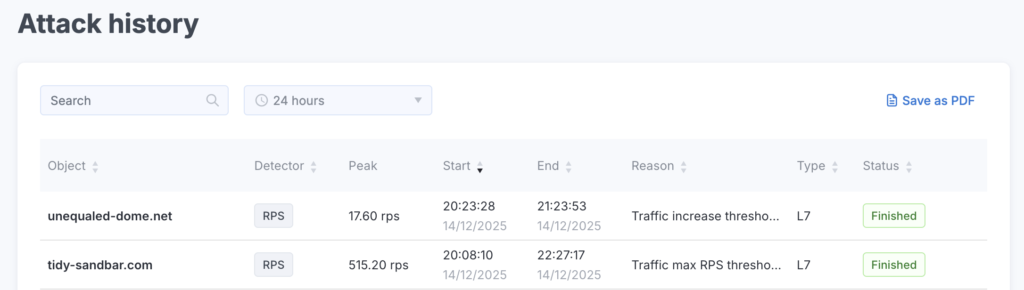
Use the search and time filters to refine the data. To download the attack history, click Save as PDF.
The term “attack” in this context refers to an event in which the protection system has classified traffic as malicious.
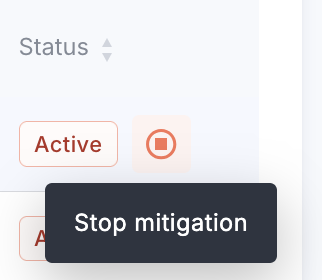
Clicking the Stop Mitigation button disables the enhanced filtering mode for this traffic.
Click the row of the attack you’re interested in to view its details.
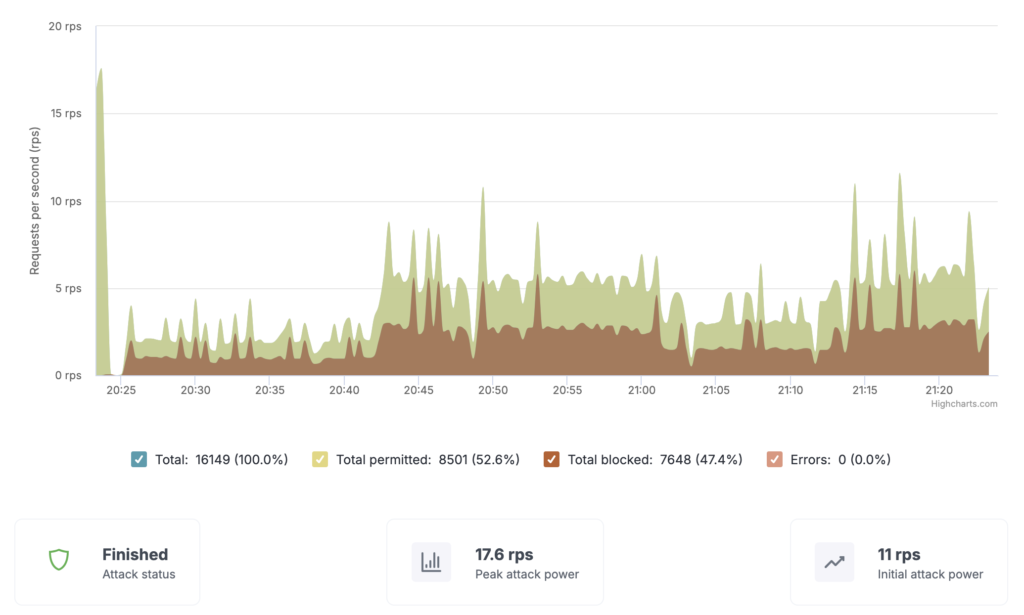
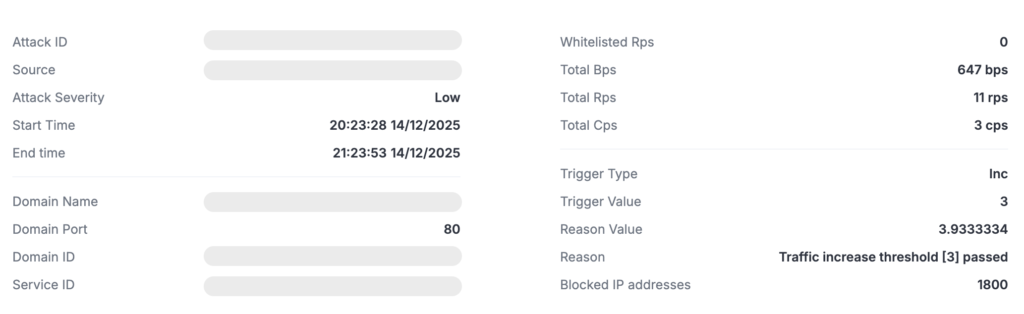
Hover your cursor over the chart to see the exact numerical values. Detailed information about the attack is displayed below the chart.
To view traffic information, go to the Traffic Details tab. This tab provides data on:
- Site requests
- Traffic volume
- Response time / response codes
- Heat map / top cities and countries
- Top locations