


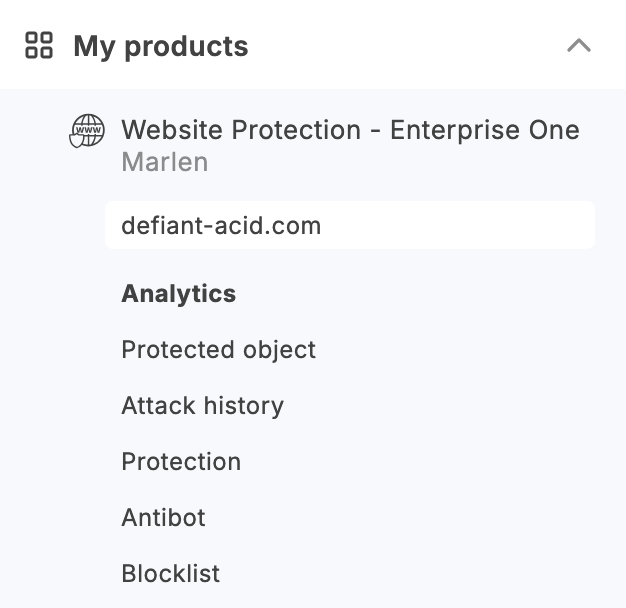
Click the chart thumbnail in the Object area to view analytical information. This will open a menu on the left side of the screen, with Analytics selected by default.
The page presents information in the format of graphs.
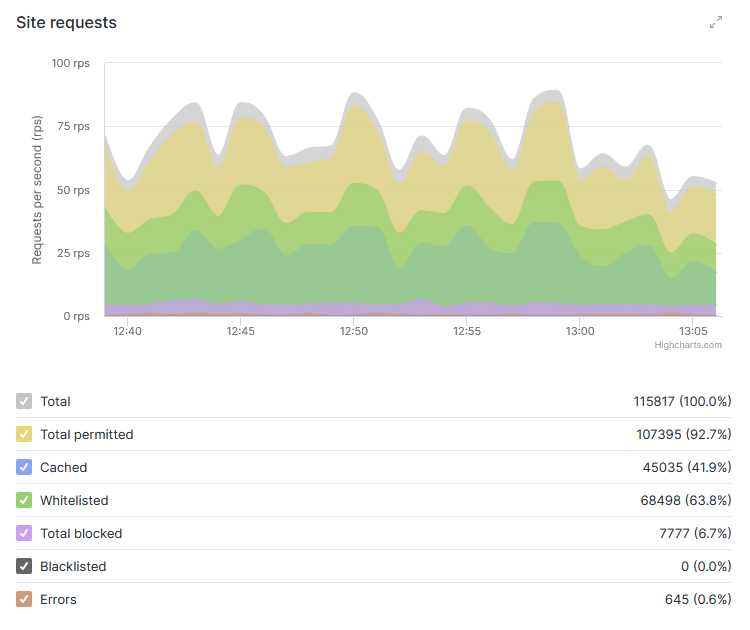
Site requests
The system tracks the dynamics of incoming site requests and their processing by the filtering system.
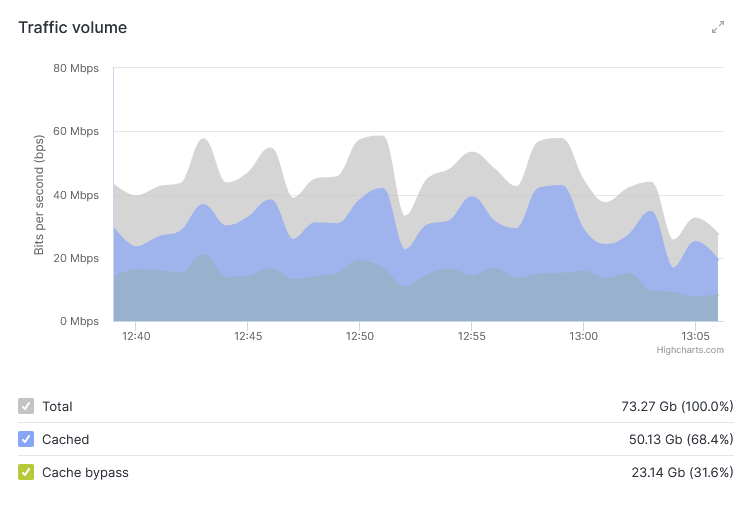
Traffic volume
Dynamics of the predominant traffic volume (incoming from the internet or outgoing from the protected resource), broken down by total traffic, data from cache, and requests processed without caching. Data is presented in bits per second (bit/s).
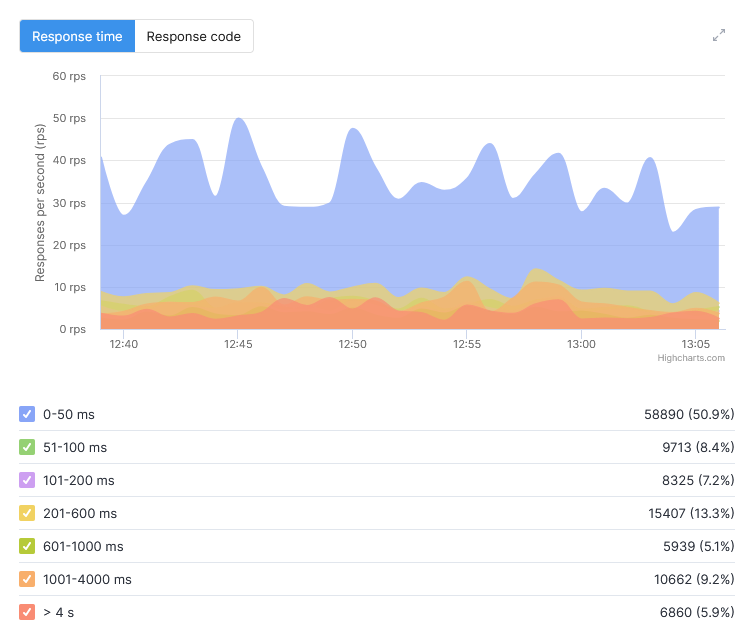
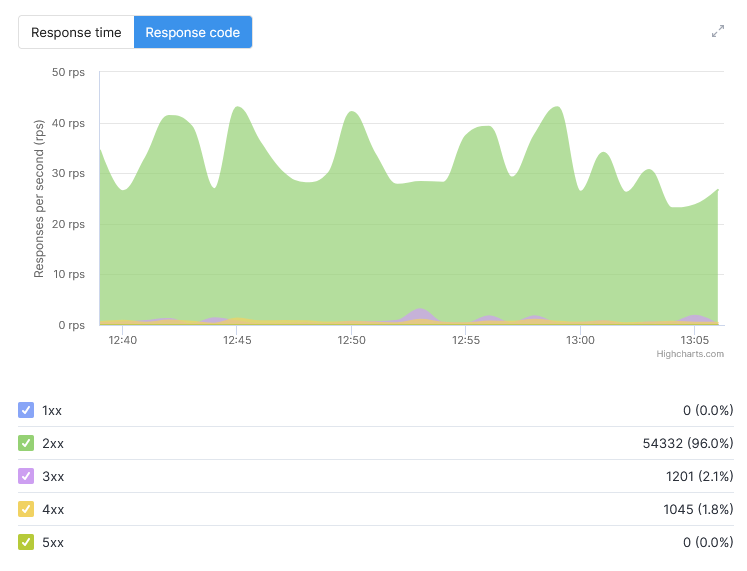
Response time / Response code
Total request processing time (with millisecond precision) after TLS connection establishment (from the start of reading headers) until all response data has been transmitted to the client, followed by request closure.
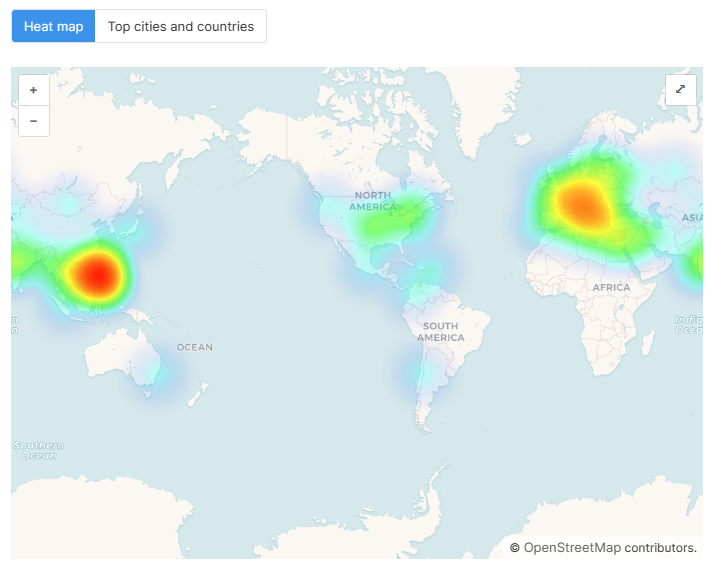
Heat map / Top cities and countries
On the Heat Map tab, you can view the geographical distribution of requests to your resources. The maximum concentration of requests is shown in red.
You can use this data to configure allow or deny rules based on geographic criteria.
To expand the map, click the arrow icon in the upper-right corner of the image.
Open the Top Cities and Countries tab to view the list of the most active sources of attacks.
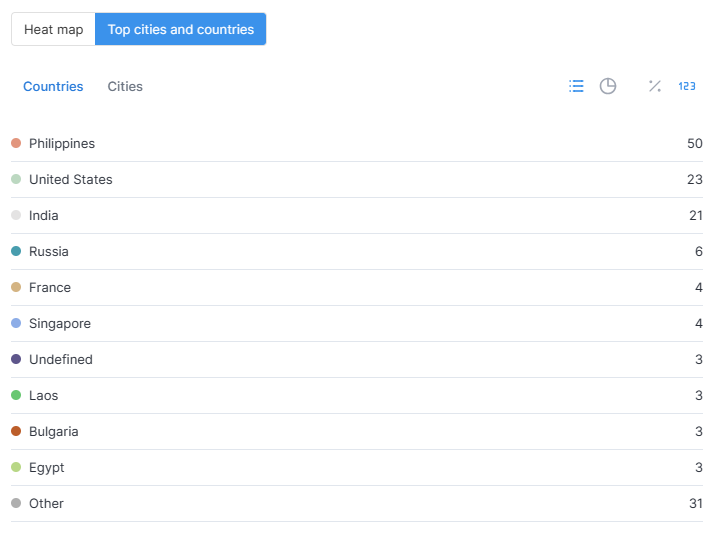
Navigate to the Cities tab to view them.
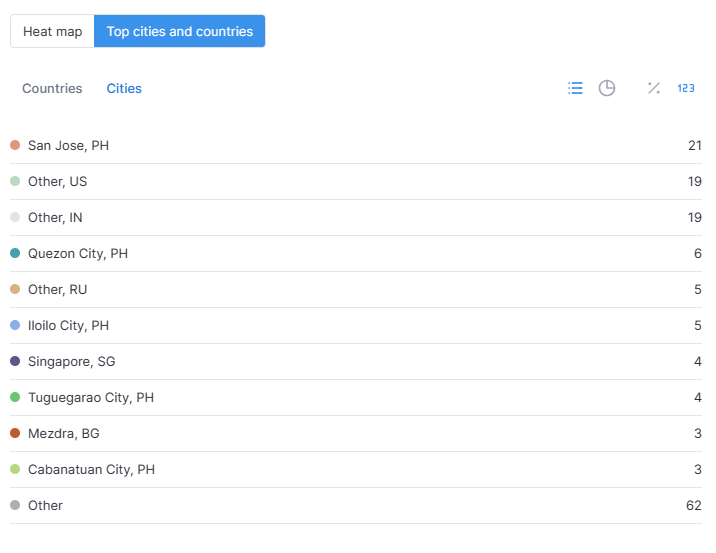
Use the toolbar in the top right corner of the window to view the results in the form of charts.
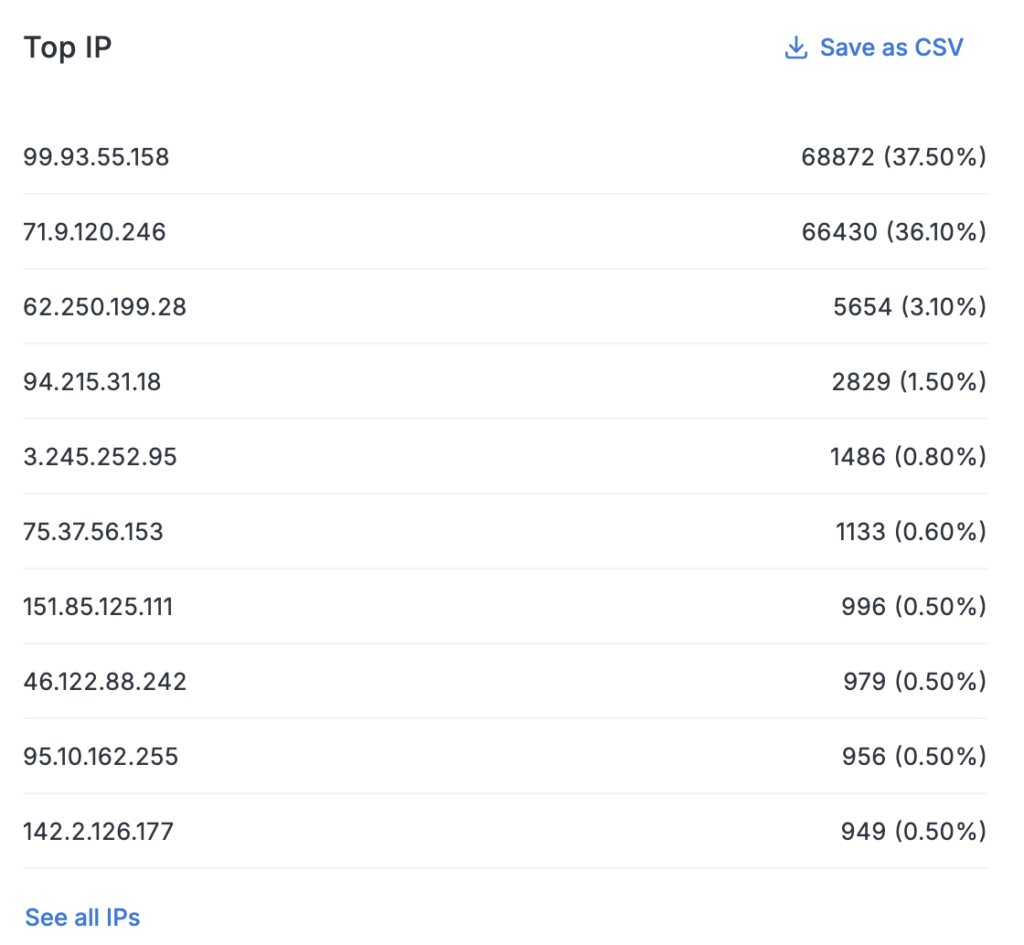
Top IP
The table shows the distribution of requests and authorizations by traffic sources (src) — that is, where exactly the requests to your resource are coming from. The data makes it possible to identify suspicious IP addresses with a high frequency of requests.
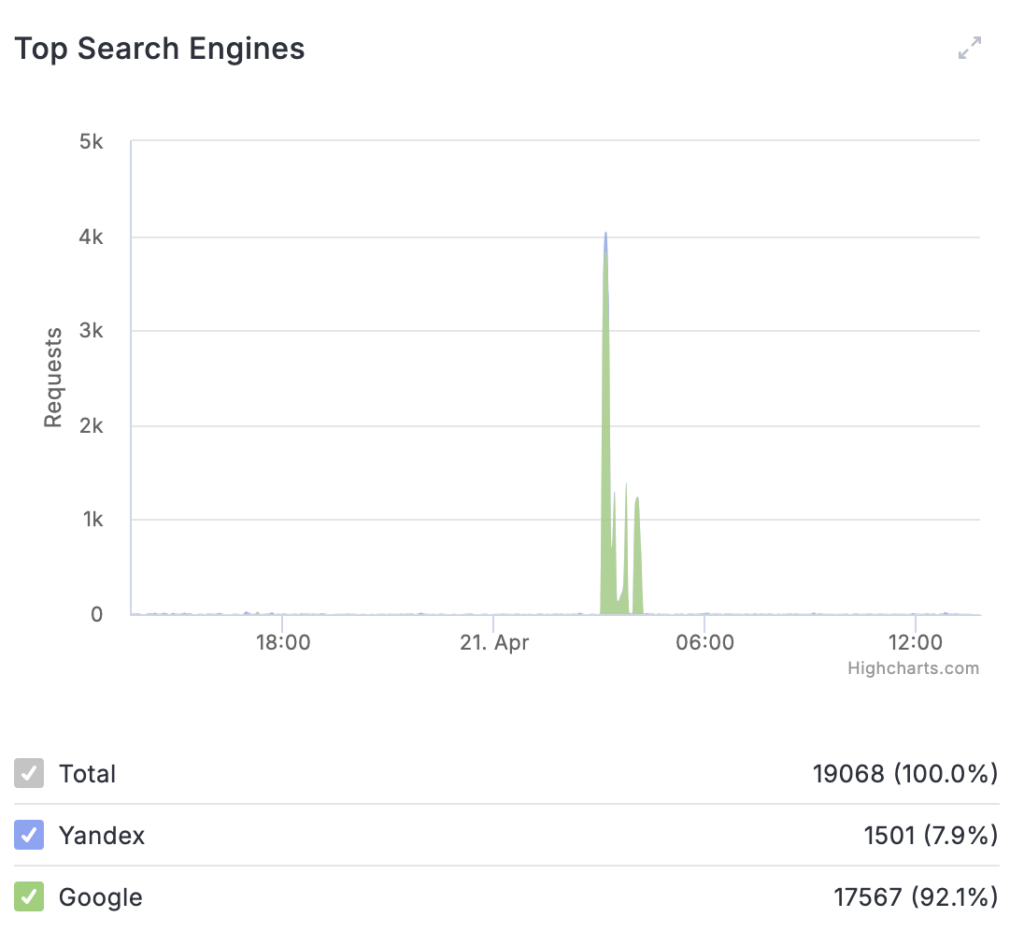
Top Search Engines
The chart shows the distribution of traffic by search services (Google, Yandex, and others) to monitor suspicious or automated requests to the API and site pages. For the selected period, the total number of requests from each search engine is displayed.
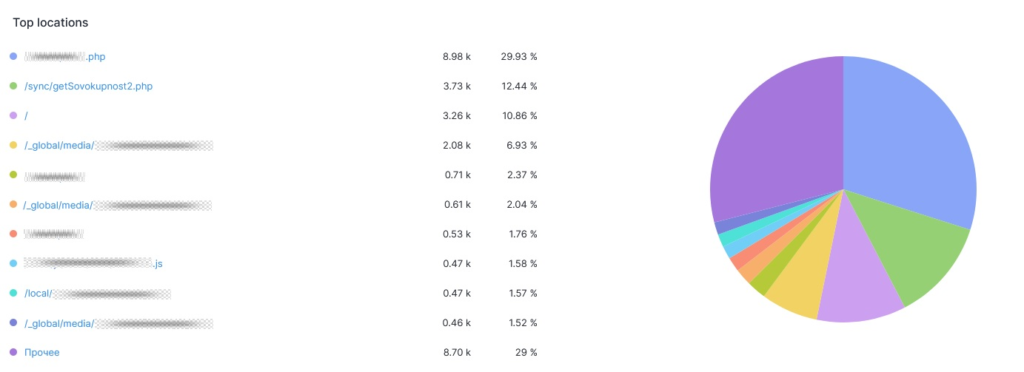
Top locations
You can view information about which parts of your resource were visited most frequently by users or targeted by attacks. For example, the main page of a site is often a common attack target.