


After the product is connected, it will appear on the main page of your Client Portal and in the My products section.
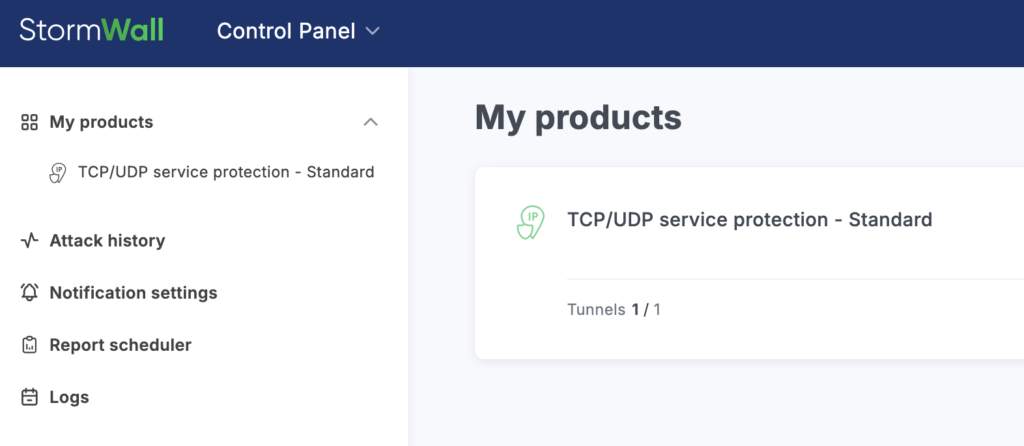
To view details, click the service name in the center of the page or in the left menu.
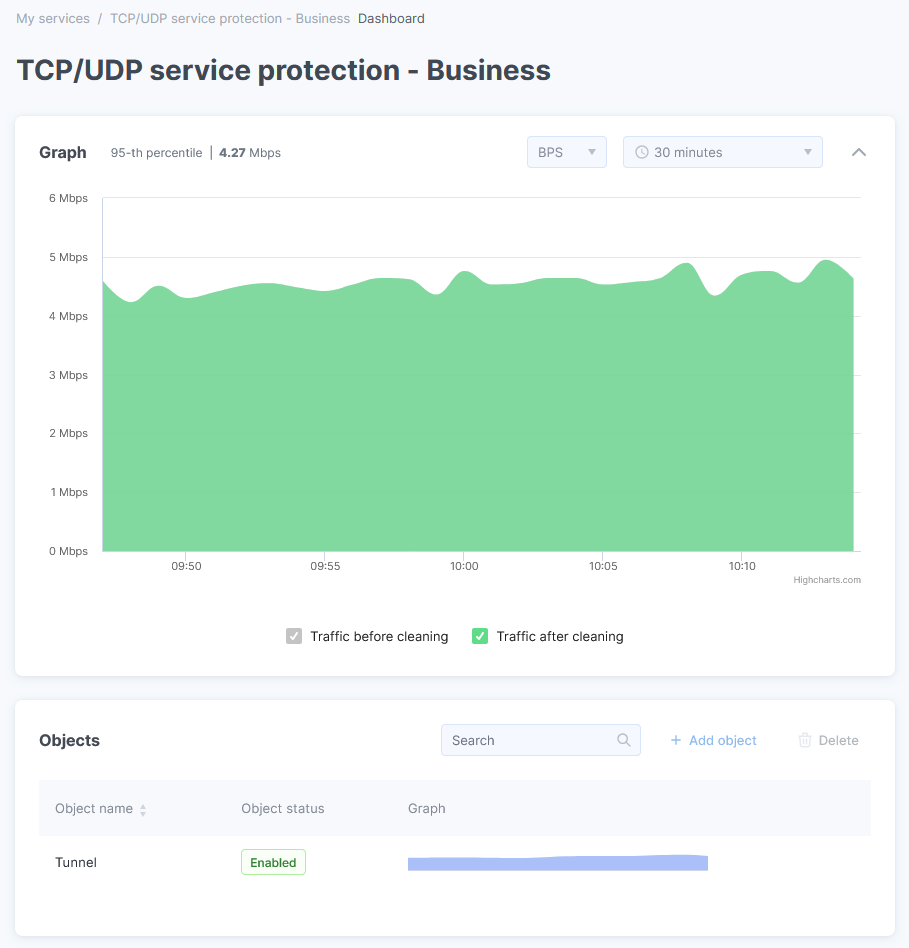
If there is only one object, a management panel will open automatically on the left side of the page.
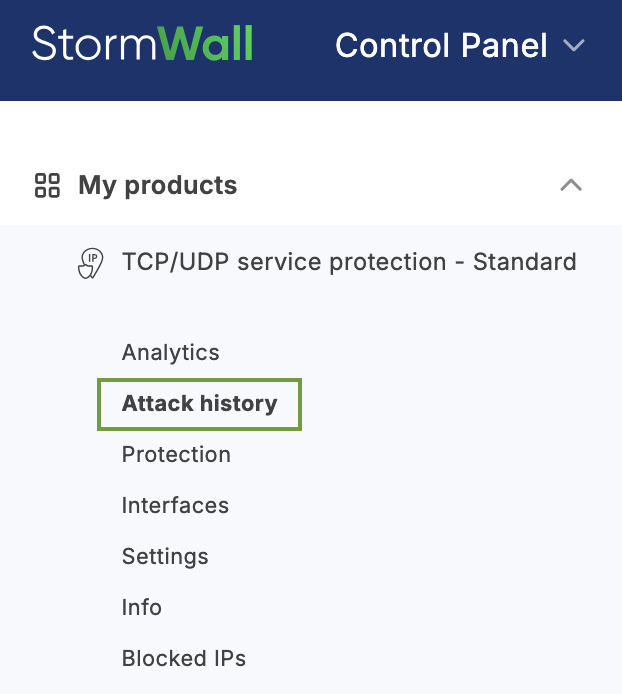
Go to the Objects section, find the object you need, and click its chart icon. This will open the management menu for the selected object on the left side of the screen.
In the menu, select Attack History.
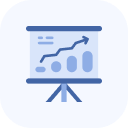
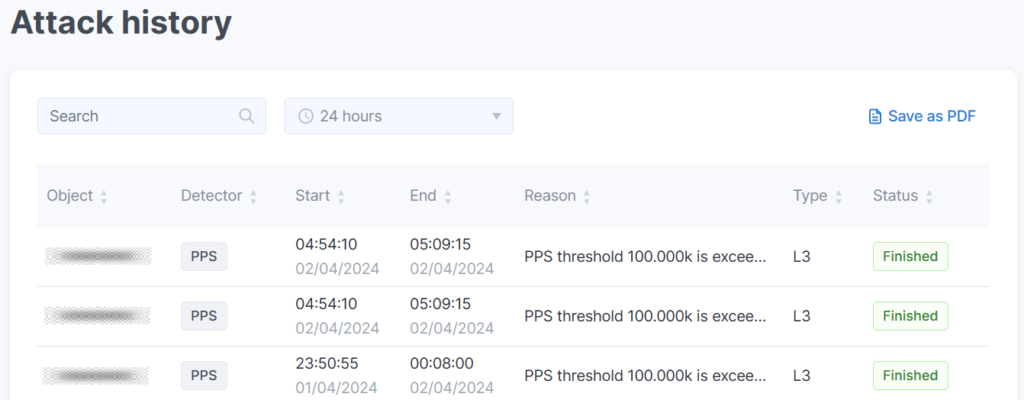
In the central part of the page, information about each attack is displayed. Use the search and time filter to narrow down the list of attacks. To save the results, click Save as PDF.
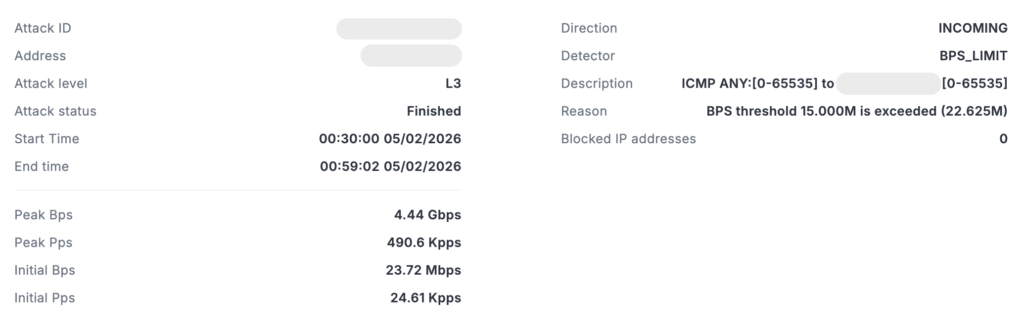
Click the attack row to view all details about it. On the Report tab that opens, a chart will be displayed.
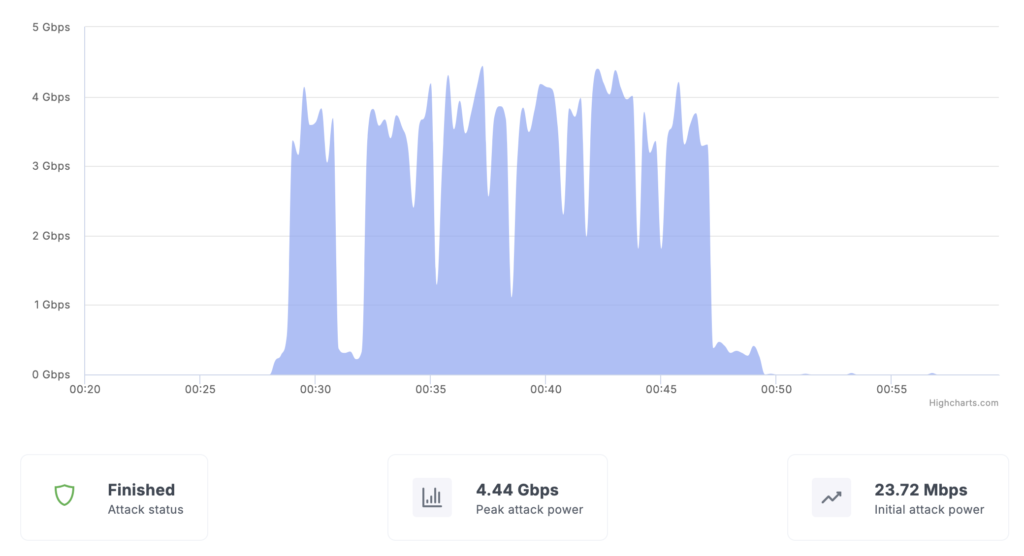
Detailed information is provided below the chart.
Navigate to the Traffic Details tab. On this page, you’ll find information about the ports, protocols, and locations recorded during the attack.