


The reports contain information about detected DDoS attacks at the L3 (network) and L7 (application) levels. The data is presented in the form of graphs and tables for convenient analysis.
Attack Graph
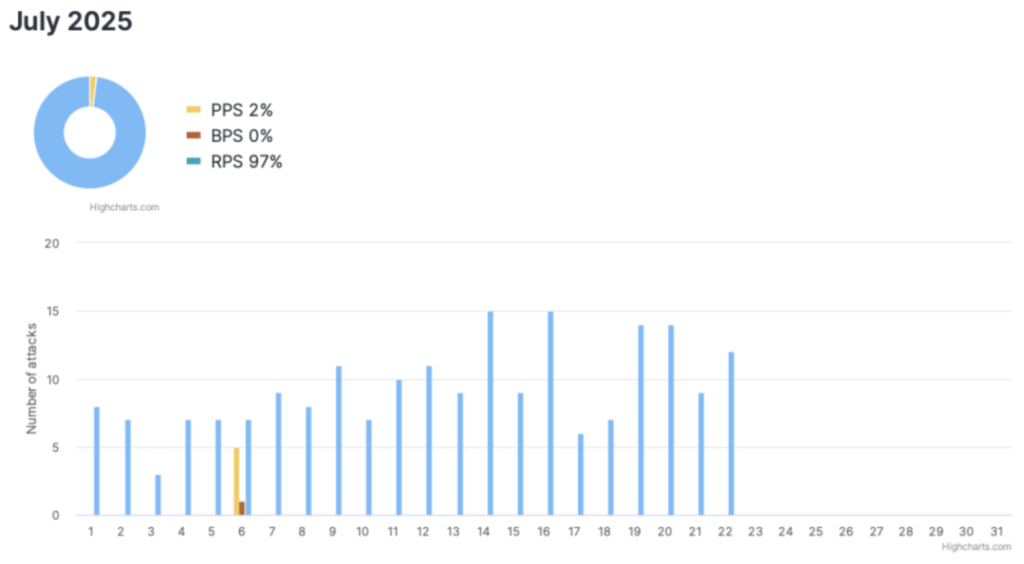
The graph displays the number of attacks during the selected period.
- The horizontal axis corresponds to the days of the month.
- The vertical axis shows the number of attacks per day.
- The colors of the bars correspond to the attack measurement units:
- PPS (Packets Per Second) – packets per second (L3, network level);
- BPS (Bits Per Second) – bits per second (L3, network level);
- RPS (Requests Per Second) – requests per second (L7, application level).
Attack Table
The table lists all recorded attacks with detailed parameters.
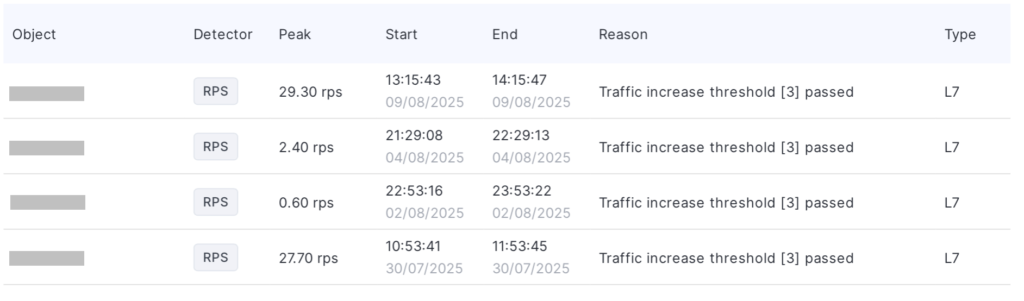
| Column | Description | Example Value |
|---|---|---|
| Target | The domain or IP address under attack. | example.com |
| Detector | The metric that detected the attack: RPS, PPS, or BPS. | RPS |
| Peak | The maximum attack value (in the detector’s units). | 235.30 rps |
| Start | The date and time when the attack began. | 2024-05-15 14:30:22 |
| End | The date and time when the attack ended. | 2024-05-15 14:45:10 |
| Reason | Which detection rule was violated (threshold exceeded). | Traffic increase threshold [3] passed |
| Type | The attack level: L3 (network) or L7 (application). | L7 |
The reports available for download in your personal account allow you to track attack attempts on your resources and evaluate the effectiveness of protective measures. If you have any additional questions while analyzing the data, we’ll be happy to help—please contact our technical support team.