


Once the service is enabled, it will appear on the main page of your Client Portal and in the My Services list.
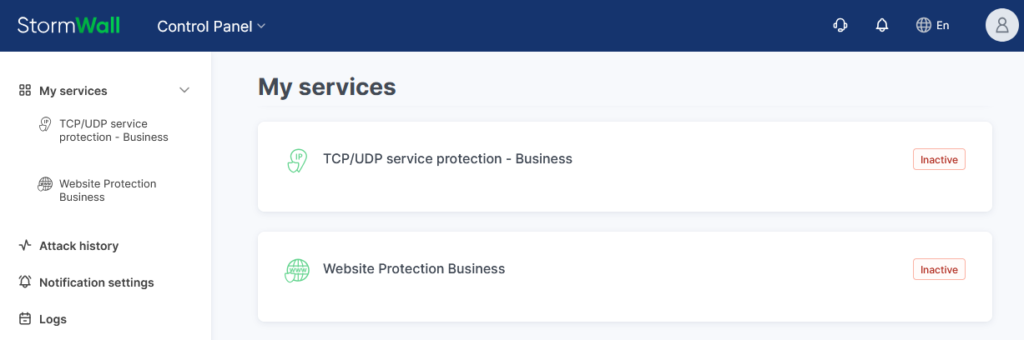
To view its details, click the service name in the central part of the page or in the left menu.
If there is only one object, the management interface will open automatically on the left side.
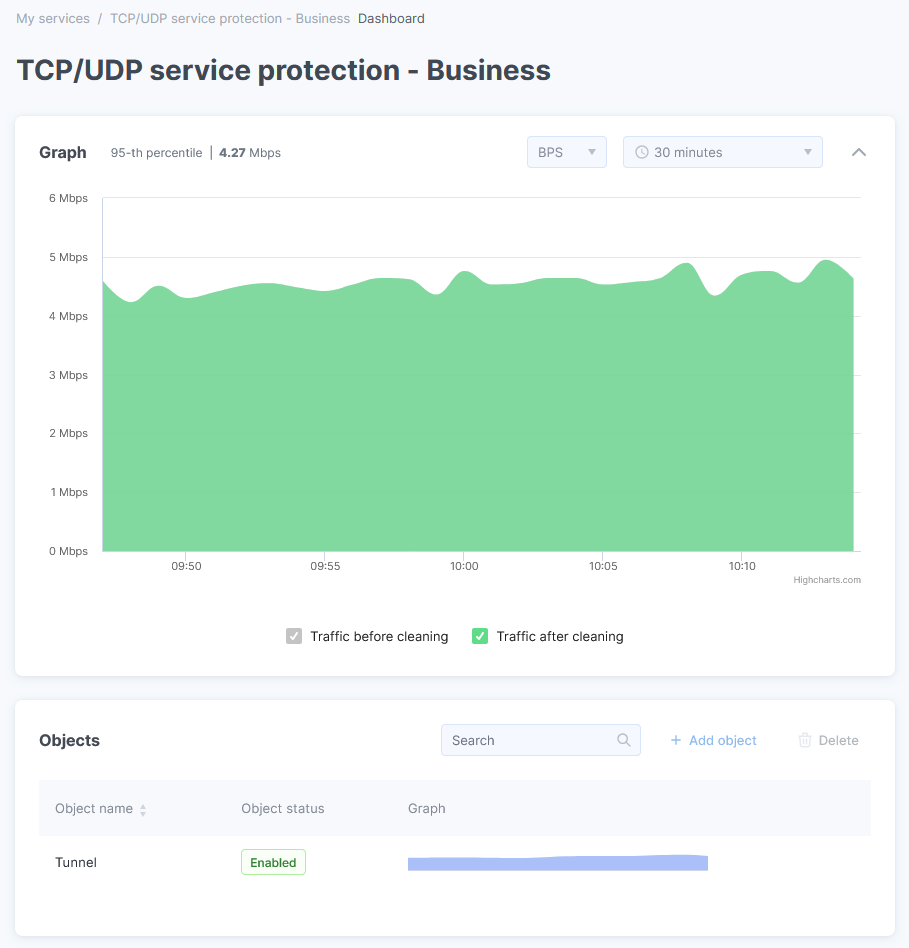
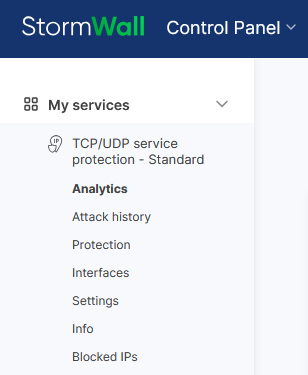
In the Objects area, select the object you want to manage and click the graph thumbnail. This will open the management menu for the object in the left panel of the page.
In the menu, select Analytics.
On the page, a dockable chart and prefix statistics are displayed. Hover over the chart with your mouse to view the data for a specific moment in time.
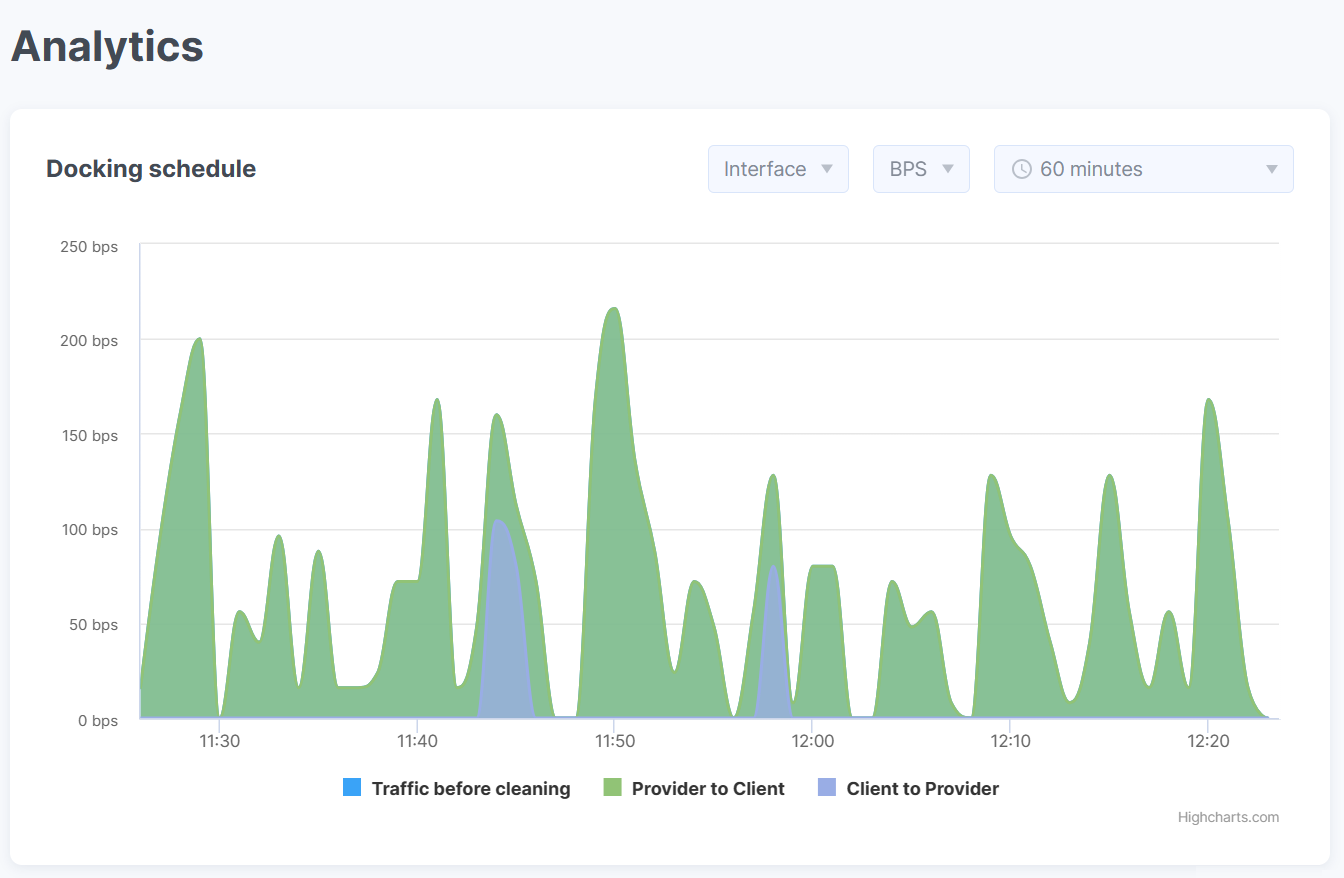
Use the tools in the upper-right corner of the chart:
- Interface / Protocol
- BPS (bits per second) / PPS (packets per second)
- Time Filter