


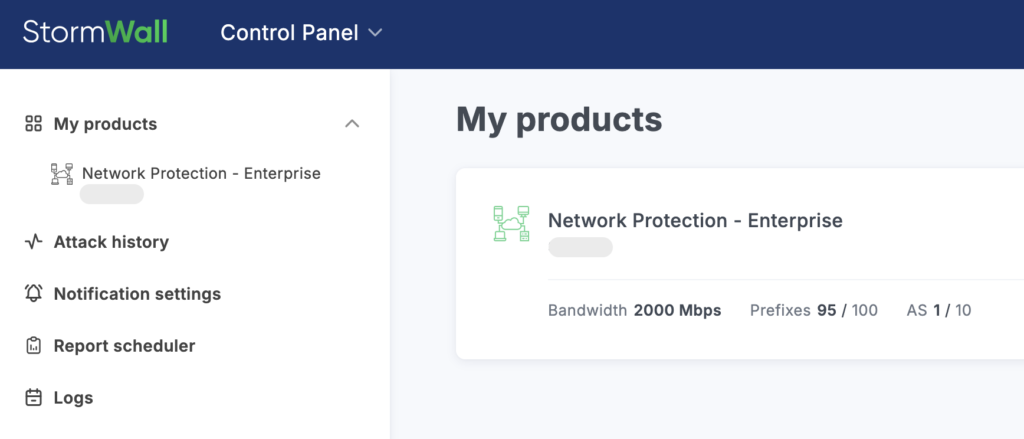
After the service is connected, it will be displayed on the main page of your account.
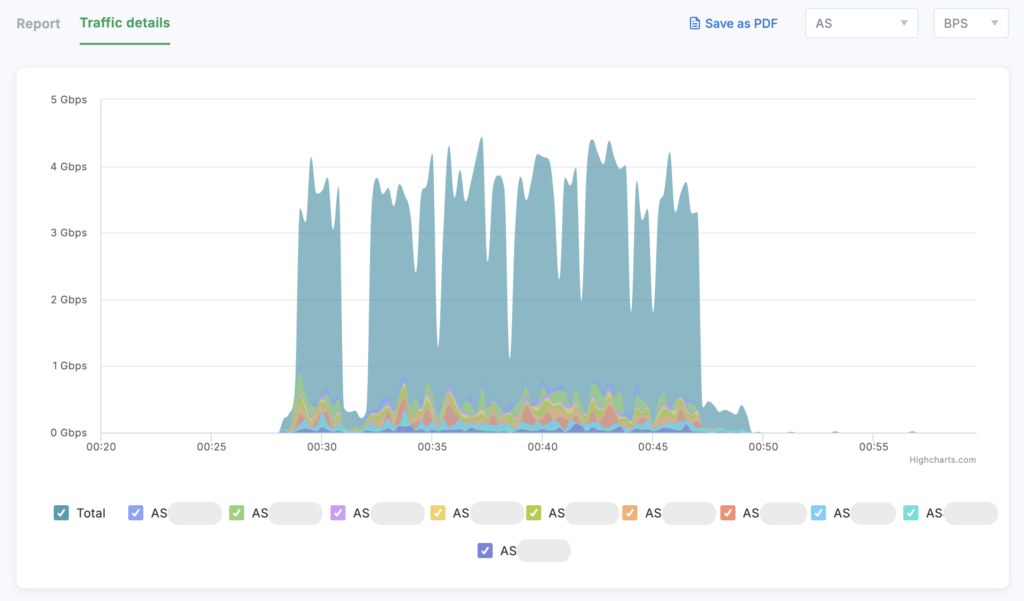
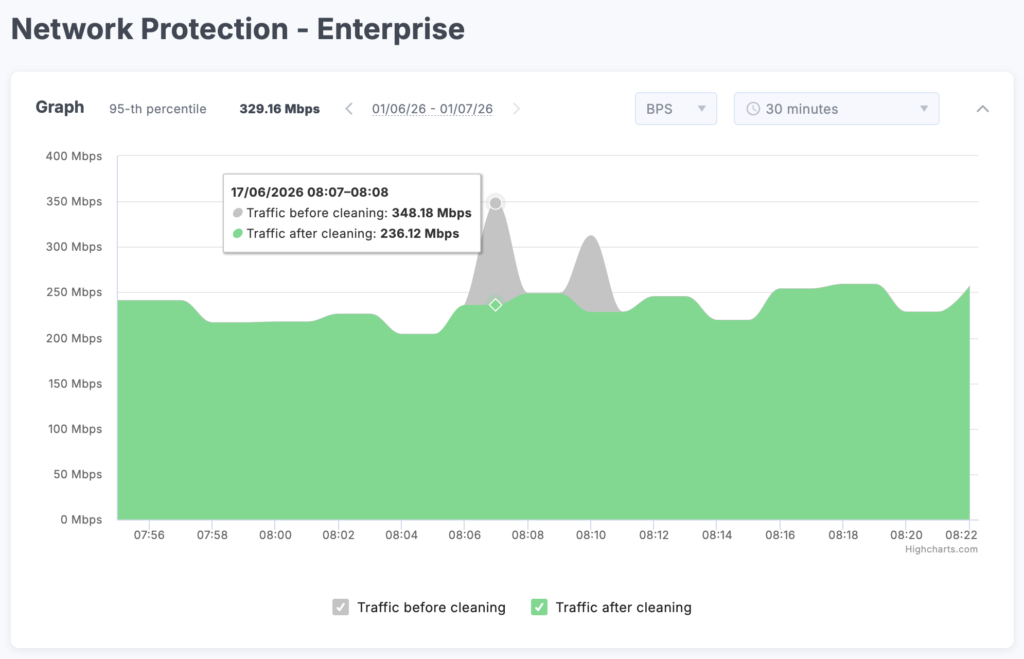
To view the details, click the service field. The chart on the page that opens shows the traffic volume before and after filtering. Use the tools in the upper-right corner of the chart:
- BPS (bits per second) / PPS (packets per second)
- Time filter
To view numerical values for a specific moment in time, hover your mouse cursor over the chart.
A list of objects is displayed, which you can edit using the Add Object and Delete buttons.
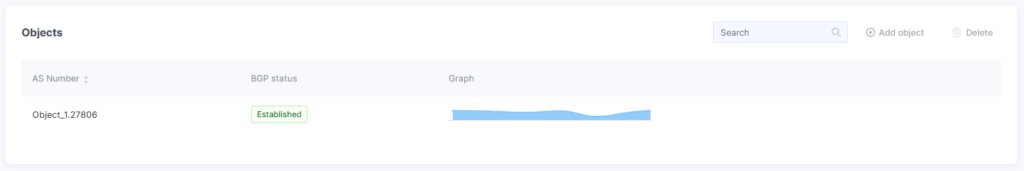
Click on the chart thumbnail in the object row to view analytical information.
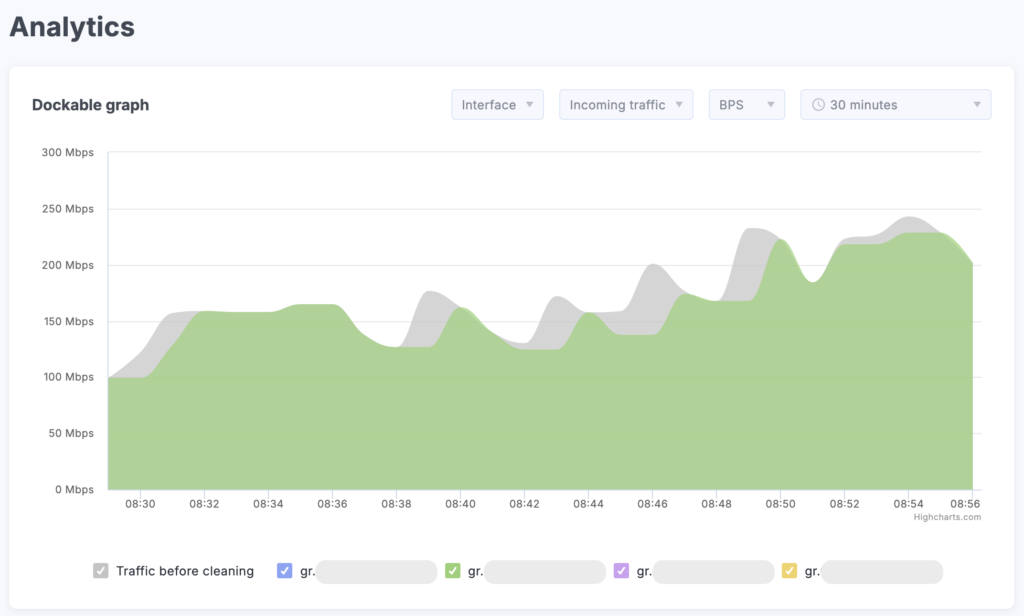
Manage the dockable chart using the toolbar above it:
- Interface / Protocol
- Outgoing Traffic / Incoming Traffic
- BPS / PPS
- Time Filter
At the bottom of the page, you’ll find the attack history table. Use the search tool and time filter to refine the information.
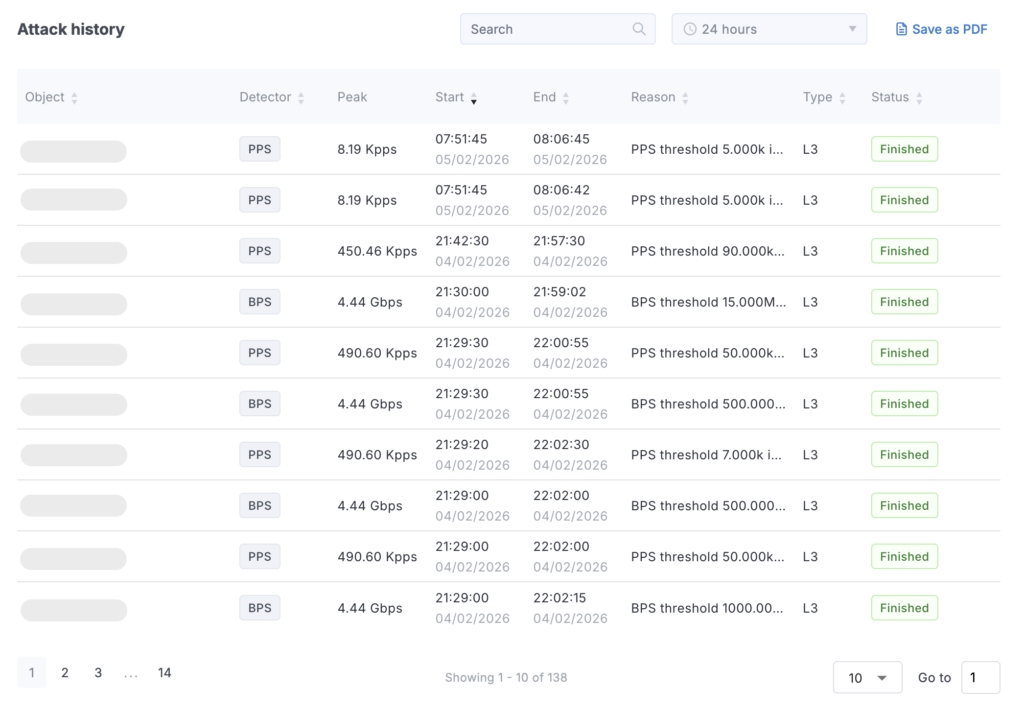
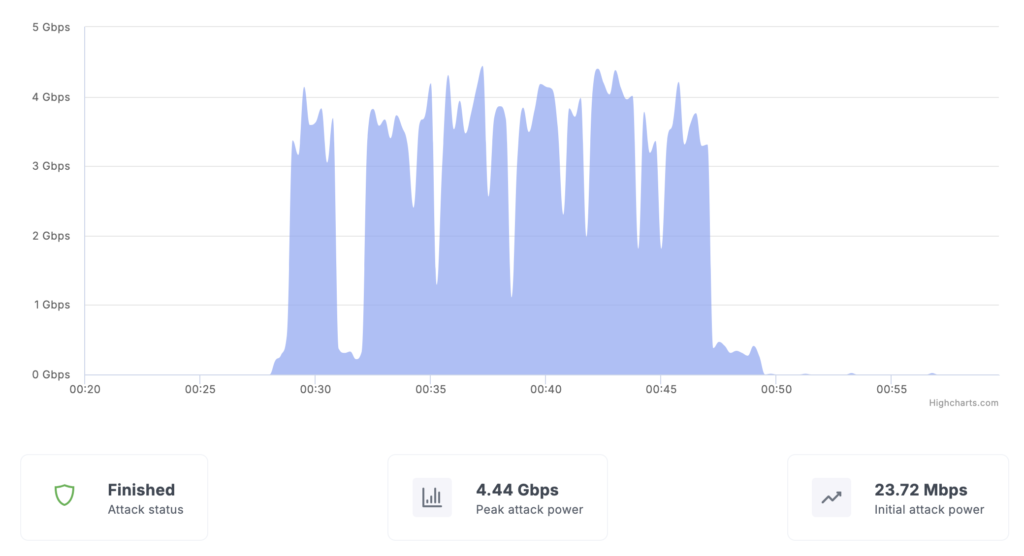
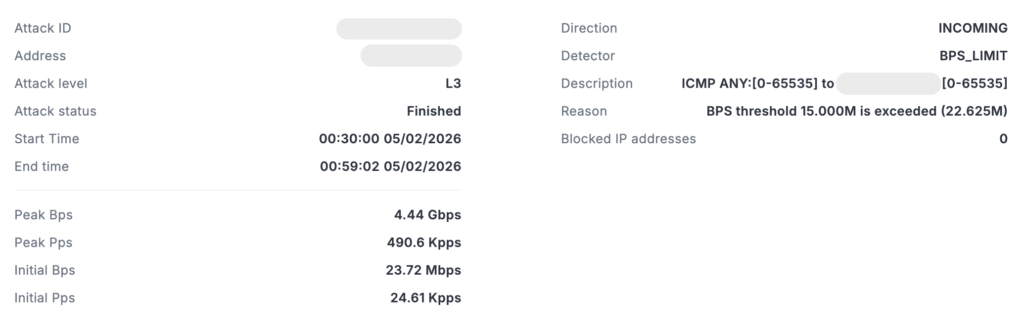
To view details about an attack, click its row. On the Report tab of the page that opens, you’ll see a chart of the attack along with detailed information. Click Save as PDF to download the attack report.
Review the information on the Traffic Details tab — here, you can view charts for each Autonomous System (AS) individually.