


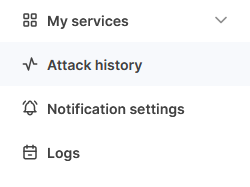
In the left sidebar of the client panel, select the Attack History option.
On the opened page, there is a table with data on all attacks on each of the objects.
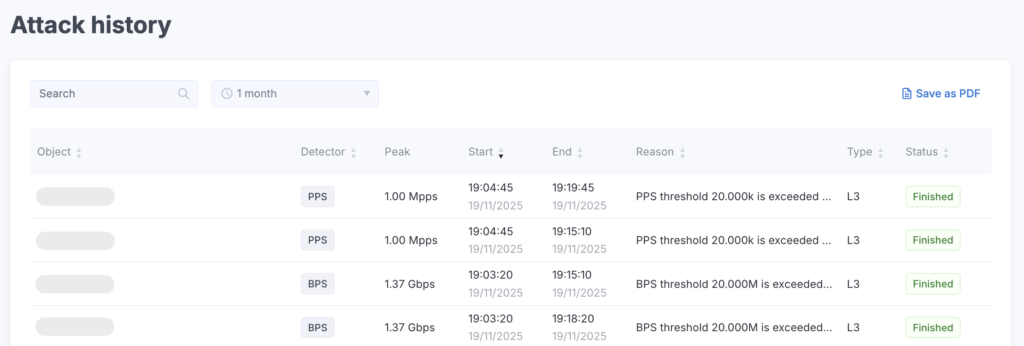
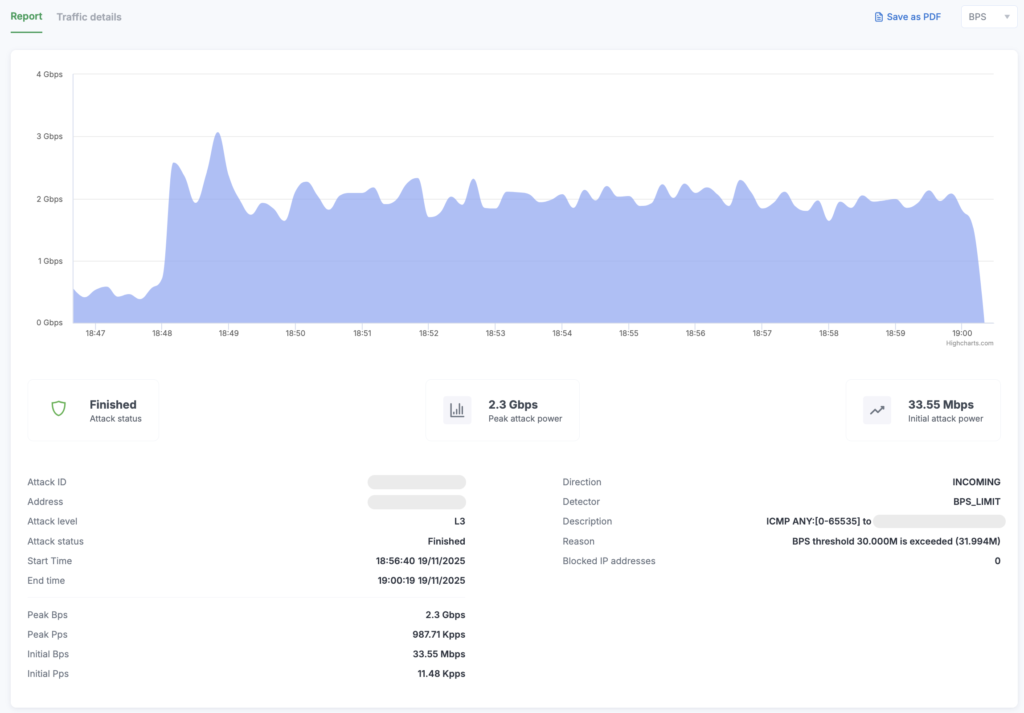
Use the Search field to filter attacks, as well as the time filter. You can also sort the table elements by clicking on the “arrow” icon next to the column header. To save the data in a file format, click the Save as PDF button. To view detailed information about an attack, click on its row in the table. A report area will open.
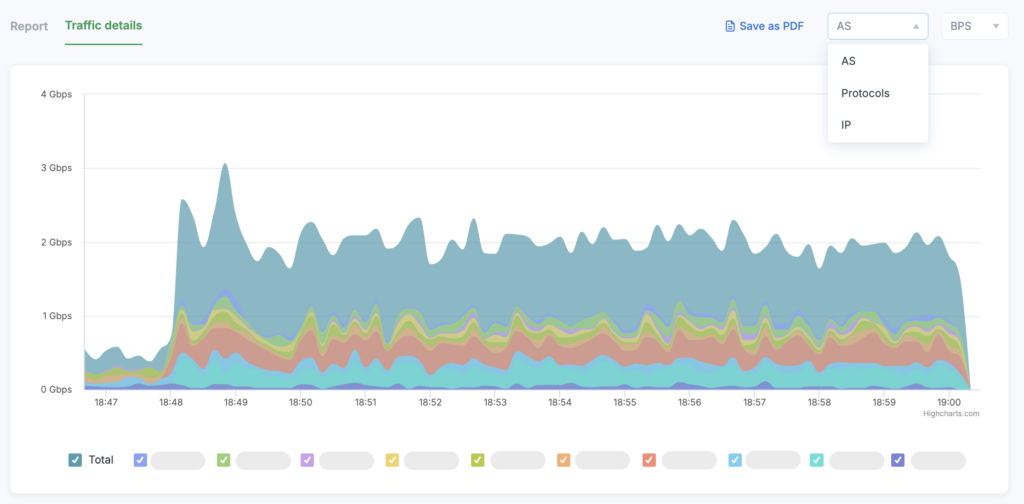
To view additional information, go to the Traffic Details tab. You can exclude an object from the chart by unchecking the box next to its name. The set of information fields depends on the type of service.