
 +44 20 3695 6722
 Sign in
In Q3 2026, StormWall mitigated 83% more DDoS attacks than during the same period in 2025. Attacks also became considerably more powerful: the average botnet size grew fivefold, while average attack bandwidth increased fourfold to 320 Gbit/s.
The threat landscape shifted following the takedown of several major botnets in March. Instead of disappearing, their capacity spread across a larger number of mid-sized botnets, many of which rely on compromised Android TV boxes and home routers. We also observed shifts in the industries and countries targeted by attackers, as well as in the geographical sources of malicious traffic.
StormWall operates scrubbing centers across the USA, Europe, Southeast Asia, and the Middle East, with more than 10 Tbit/s of combined filtering capacity. Our global infrastructure gives us a firsthand view of these developments.
Q3 2026: Main Trends
The main developments during this quarter were:
- The average botnet size grew from approximately 30,000 to 150,000 devices.
- Average attack bandwidth rose from 80 to 320 Gbit/s.
- Financial services remained the most targeted industry, while retail recorded the largest increase in its share of attacks.
- The USA, China, and India were the most attacked countries. In the Middle East, attacks shifted toward the Gulf states.
- Mexico became the leading source of DDoS traffic in StormWall’s data for the first time.
DDoS Attacks Up 83%
The total volume of attack traffic grew even faster. With 83% more attacks and a fourfold increase in average attack power, StormWall’s network absorbed roughly seven times the volume of DDoS traffic recorded in Q3 2025.
The distribution of attacks also changed. In Q2, more than 70% of attacks were attributed to hacktivist groups, while telecommunications and government organizations represented a relatively large share of the targeted industries. In Q3, retail accounted for a larger share of attacks, while the shares of telecommunications and government decreased.
Average Botnet Size Up 5×
| Metric | Q3 2025 | Q3 2026 | Change |
| Average botnet size | ~30,000 devices | ~150,000 devices | 5× |
| Average attack power | 80 Gbit/s | 320 Gbit/s | 4× |
This growth followed an international law enforcement operation in March 2026. Authorities seized the command-and-control (C2) servers of four major IoT botnets, including Aisuru and Kimwolf. Together, the four botnets controlled more than 3 million devices. As we noted in our Q2 report, the operation did not lead to a decline in overall DDoS activity.
Instead, attack capacity spread across many mid-sized botnets, each far larger than a typical botnet a year earlier. Several botnets active in Q3 illustrate this shift:
- Dysphoria is built on code from one of the disrupted botnets and grew to more than 200,000 devices within four months.
- JackSkid regrouped after the takedown. Its malware combines a DDoS bot with a residential proxy relay.
- Kimwolf v7, a new version that emerged after the takedown, reaches Android TV boxes through residential proxy networks. It also uses an HTTP/2 flood designed to imitate the Chrome browser’s fingerprint.
- Evooo1Bot, active since July 2026, is based on Mirai and turns compromised routers into traffic relays.
Much of this capacity runs on inexpensive consumer hardware, particularly Android TV boxes and home routers. Many TV boxes have an exposed Android Debug Bridge (ADB) port, and some are sold with malware already installed.
Residential proxy networks provide another way to use compromised devices. Their operators rent out the devices’ home IP addresses, but those same devices can also be redirected to generate DDoS traffic.
Read more: What Are Botnets and How Are They Used in DDoS Attacks?
Average Attack Power Up 4×
The average attack StormWall mitigated in Q3 reached 320 Gbit/s, compared with 80 Gbit/s a year earlier. For context, many corporate internet connections have a capacity of just 1–10 Gbit/s. An attack of this scale is more than 30 times the capacity of a 10 Gbit/s connection, making upstream filtering essential: malicious traffic must be stopped before it reaches the target’s network.

Network Protection from DDoS Attacks
- Activate protection within 10 minutes
- 24/7 technical support
Despite the increase in overall attack power, the average traffic generated by an individual infected device fell from 2.7 Mbit/s to 2.1 Mbit/s. This is consistent with the shift toward larger botnets made up of low-powered consumer devices.
Across the industry, the number of attacks exceeding 1 Tbit/s grew more than sixfold between Q1 and Q2 2026.
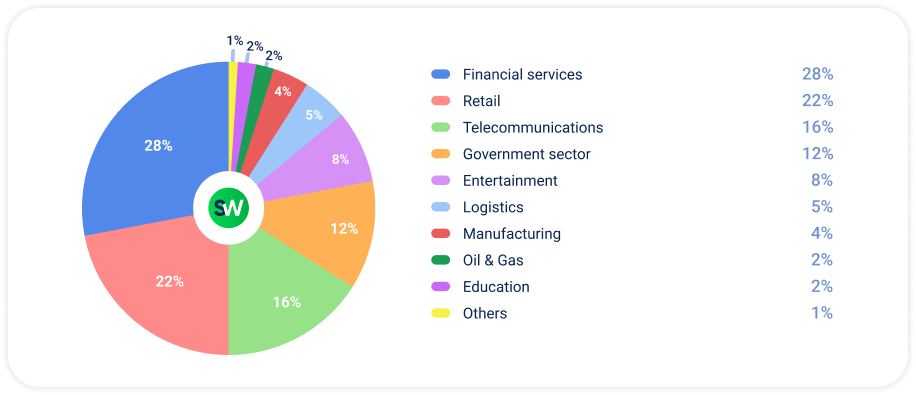
Attack Share Breakdown by Industry
Financial services remained the most targeted sector in Q3, followed by retail and telecommunications.
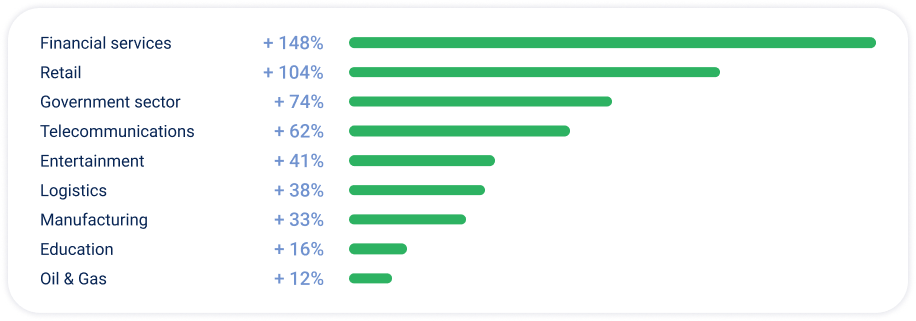
The year-over-year figures show that the increase was not limited to the three most targeted sectors:
Compared with Q2, retail recorded the most significant change: its share of attacks rose from 8% to 22%. Financial services also gained ground, moving from 26% to 28%. By contrast, telecommunications fell from 22% to 16%, government from 14% to 12%, entertainment from 12% to 8%, and oil and gas from 4% to 2%.
Government bodies in Europe remained a target for politically motivated attacks. On August 24, the Norwegian Digitalisation Agency (Digdir) came under a DDoS attack that lasted approximately three days and disrupted 10 public services. These included the national login system, used by more than 4.5 million people. It was the largest attack in the agency’s history and the third since June.
Relative Risk of DDoS
The table below compares the distribution of attacks across industries. It shows how frequently each sector appeared among the targets in StormWall’s data.
| Industry | Relative share |
| Financial services | ~1 in 3.5 |
| Retail | ~1 in 4.5 |
| Telecommunications | ~1 in 6 |
| Government sector | ~1 in 8 |
| Entertainment | ~1 in 12.5 |
| Logistics | ~1 in 20 |
| Manufacturing | ~1 in 25 |
| Oil & Gas | ~1 in 50 |
| Education | ~1 in 50 |
| Others | ~1 in 100 |
Note: These figures reflect the relative distribution of attacks across industries, not the actual probability that a particular organization will be attacked. An organization’s individual risk depends on its exposure, its security posture, and whether it is being actively targeted.
The Three Most Targeted Industries
1. Financial Services
Financial services accounted for 28% of attacks in Q3, the largest share of any industry. The sector also recorded the highest year-over-year growth, at 148%.
Banks and payment providers are attractive targets for extortion. Even a short interruption can prevent customers from making payments or transferring money. In one case observed by StormWall, a bank remained under DDoS attack for approximately 200 hours, or more than eight days.
Attackers frequently focused on login pages and APIs. Flooding a shared authentication endpoint can prevent customers from accessing online banking, even when the rest of the website remains available.
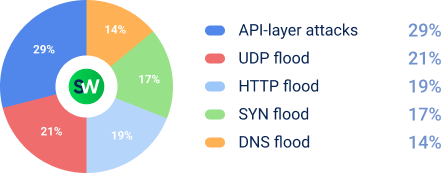
The distribution of attack vectors reflects this focus:
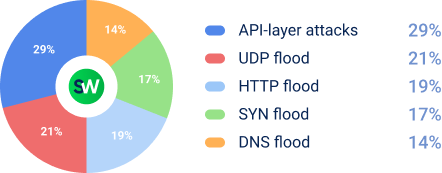
API-layer attacks were the most common vector. UDP floods saw the sharpest change: their share nearly doubled, from 11% in Q2 to 21% in Q3. This type of traffic is commonly generated by IoT botnets.
2. Retail
Retail accounted for 22% of attacks, up from 8% in Q2. The number of attacks on the sector also increased by 104% year-over-year.
Most campaigns were financially motivated. Attackers sent ransom demands to online stores or timed their activity to coincide with sales, when downtime can be particularly costly.
Checkout pages and payment APIs were among the main targets. HTTP floods were the most common attack type. They were often launched from residential IP addresses and designed to imitate requests from real browsers.
Online stores also face growing volumes of automated traffic outside DDoS campaigns. Over the past year, bad-bot traffic increased by 124%, compared with 13% growth in human traffic. Scrapers and bots that reserve products in shopping carts consume the same server resources as legitimate customers, leaving less capacity available when an attack occurs.
3. Telecommunications
Telecommunications accounted for 16% of attacks in Q3, down from 22% in Q2. However, the number of attacks on the sector still increased by 62% year-over-year.
Many campaigns against internet service providers used carpet bombing: attackers spread traffic across a provider’s entire IP range, hitting each address for only a short time — often 10–60 seconds — before moving on to the next. These bursts can remain below the thresholds used by protection systems, making them harder to detect.
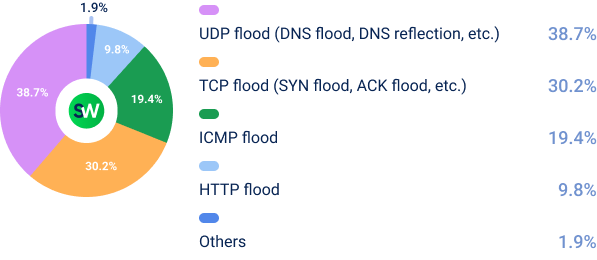
UDP floods overtook TCP floods as the leading attack vector against telecommunications providers. The change is consistent with the growing role of IoT botnets, which commonly generate UDP traffic.
DDoS Attacks Breakdown by Country
The USA, China, and India remained the three most attacked countries in Q3 2026. Together, the top three accounted for 40.3% of the DDoS traffic mitigated by StormWall, almost unchanged from 40.4% in Q2.
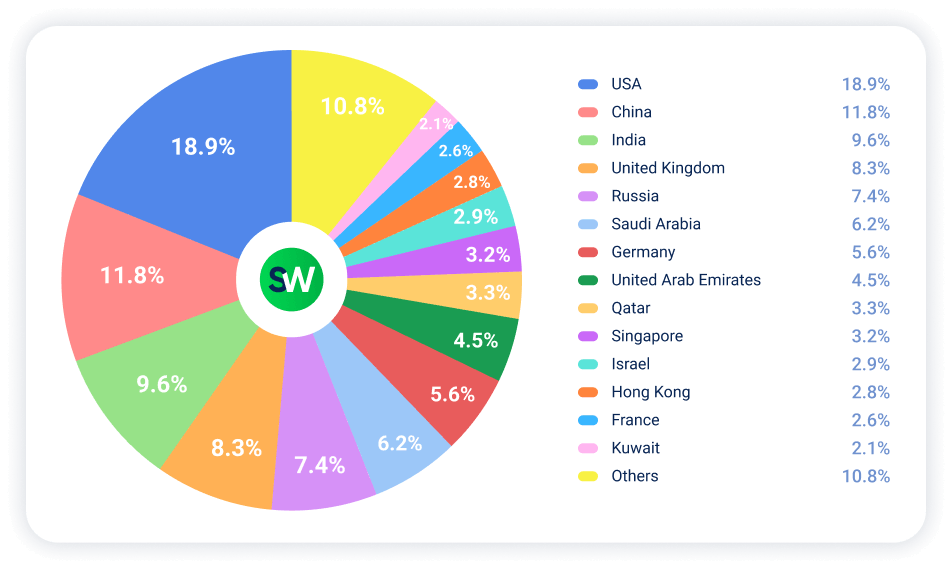
The most notable regional shift took place in the Middle East. Attack activity moved away from Israel and Iran toward the Gulf states. Saudi Arabia rose to sixth place globally, while Qatar and Kuwait entered the top 14. Saudi Arabia’s share increased from 4.2% to 6.2%, and attacks on the country grew by 136% year-over-year.
Other notable changes between Q2 and Q3 included:
- USA: 17.4% → 18.9%
- Iran: 7.2% → 1.2%
- Israel: 6.4% → 2.9%
- United Kingdom: 9.7% → 8.3%
- Russia: 8.6% → 7.4%
Main Sources of DDoS Attacks
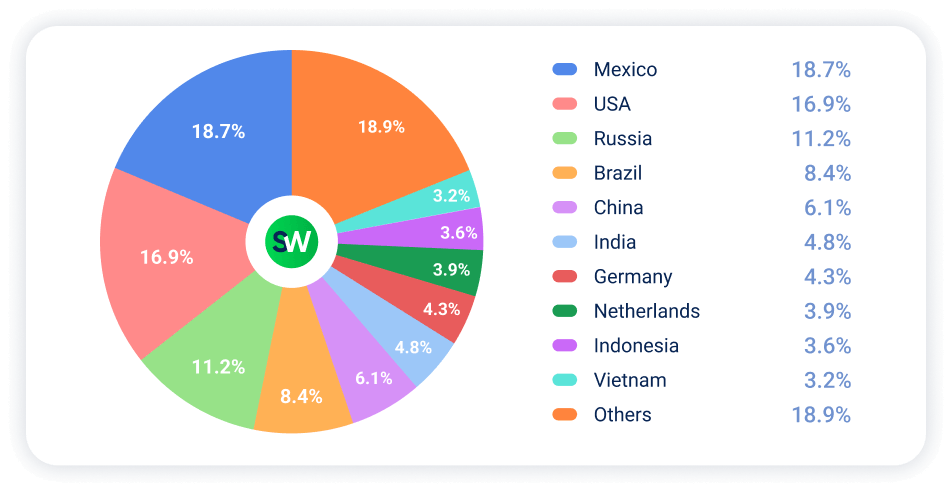
The countries where attack traffic originated were different from the countries most frequently targeted. Mexico, the USA, and Russia were the three largest sources, together accounting for 46.8% of the traffic mitigated by StormWall.
Mexico
Mexico became the largest source of DDoS traffic in StormWall’s data for the first time. It was not among the five leading sources in Q1, but its share increased every month from April through September.
Most of the traffic came from compromised home routers and IoT devices connected to the country’s largest broadband networks. Approximately 63% of it carried the signature of Mirai-family floods, the highest proportion among the major source countries. A significant part of this traffic was directed at targets in the USA.
USA
The USA was the largest source of attack traffic in Q1, at 23.8%, but its share fell to 16.9% by Q3.
Cloud and hosting networks were responsible for much of the US-originating traffic. Around 41% of US-originating application-layer attacks came from large cloud and VPS providers, where attackers rent servers or take control of poorly secured ones. Home internet providers accounted for approximately 8%.
Some notable changes between Q1 and Q3 were:
- Brazil: 11.1% → 8.4%
- Russia: 9.2% → 11.2%
- China: 8.8% → 6.1%
Preparing for the Holiday Season
The holiday shopping season puts additional pressure on online stores and payment systems. As transaction volumes rise, even a short service interruption can cost sales and damage customer trust.
Retailers and financial institutions should make sure their DDoS protection can handle attacks of several hundred Gbit/s and that filtering happens upstream, before malicious traffic reaches their infrastructure.
Is your infrastructure ready for the holiday peak? StormWall filters malicious traffic upstream, with more than 10 Tbit/s of capacity across scrubbing centers in the USA, Europe, Southeast Asia, and the Middle East. Contact our team to test your DDoS protection before the season starts.

DDoS Protection for Websites
- Activate protection in 10 minutes
- 24/7 technical support
