


The rules have changed again. The main driving force behind DDoS attacks worldwide is no longer politics, but profit—and cybercriminals’ most effective weapon has become the nearly invisible “carpet-bombing” attack. What does this mean for your business? A full breakdown of the latest trends and emerging threats is available in our Q3 2025 report.
What Defined Q3 2025?
Overall, DDoS attacks increased by 82% year-over-year, although that’s slightly lower than the 108% growth we recorded last quarter.
While the overall growth rate has slowed, the type of attacks has shifted significantly. If you’ve been following our reports, you know that throughout 2024 and much of 2025, hacktivism was the main driver of malicious DDoS activity. This quarter, however, profit-motivated attackers became the dominant force.
One of the most important findings of Q3 2025 is that carpet-bombing attacks are up by 116%. This is a type of Distributed Denial-of-Service (DDoS) attack where malicious traffic is spread across many IP addresses within a subnet or network instead of hitting a single target.
These attacks have become 76% powerful on average. They are specifically engineered to bypass traditional DDoS defenses by keeping traffic to each individual IP address below alert thresholds.
Carpet bombing almost always relies on botnets, since this method requires distributing traffic across multiple targets at once. Last quarter, we reported a massive surge in botnet size—an 87% quarter-over-quarter increase, raising the average botnet from 85,000 to 135,000 devices. Now, we’re seeing the direct consequences of that growth.
Learn more: Carpet Bombing DDoS Attacks
Who Was Targeted Most?
Now, let’s break down the distribution of DDoS attacks by industry in Q3 2025:

Industries with highest YoY growth in DDoS attacks in Q3 2025:

Now let’s look at how the relative share of attacks changed from Q2 to Q3 2025:
- Telecommunications were hit the hardest this quarter, jumping from 11% in Q2 to 26% in Q3.
- Finance remained under heavy pressure, rising from 18% to 22%.
- Retail saw its share increase from 9% to 14%.
- Government experienced a sharp decline, dropping from 31% to 10%.
- Transportation fell from 14% to just 4%.
- Entertainment platforms doubled their share—from 6% to 12%.
The key trend is clear: high-profile targets, which attackers often hit for visibility, made up a smaller share of attacks this quarter. Meanwhile, industries more vulnerable to extortion saw a significant rise.
Who’s at the highest risk of DDoS, and who is least likely to be attacked? The table below shows the relative likelihood by sector:
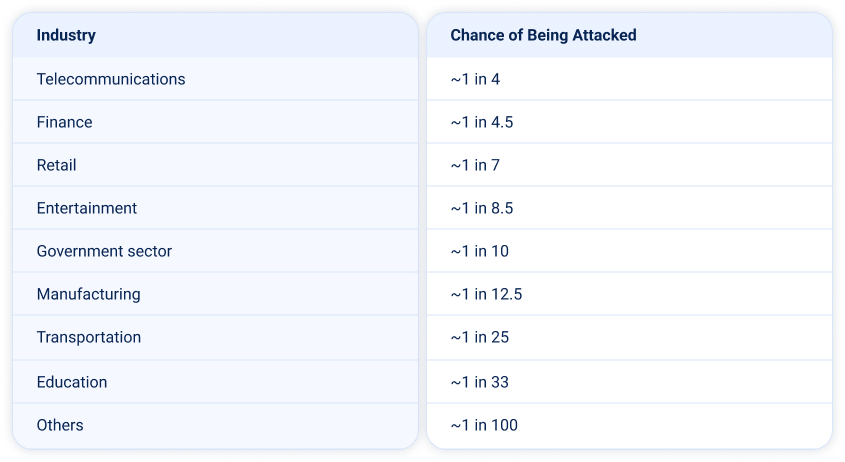
Note: this reflects relative risk based on the global distribution of attacks. Your actual risk will also depend on factors such as your exposure surface, your organization’s overall security posture, and whether threat actors are actively targeting you.
Top 3 Most Attacked Sectors: A Closer Look
Let’s dive deeper into the top 3 most targeted industries.
Telecommunications
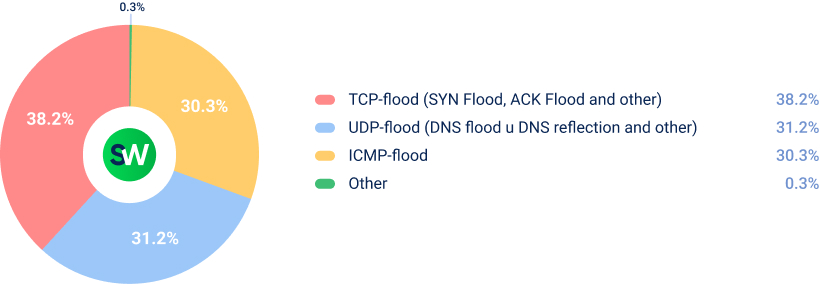
Telecom companies accounted for 26% of all DDoS attacks, with a 132% year-over-year increase, making this the most targeted sector of the quarter.
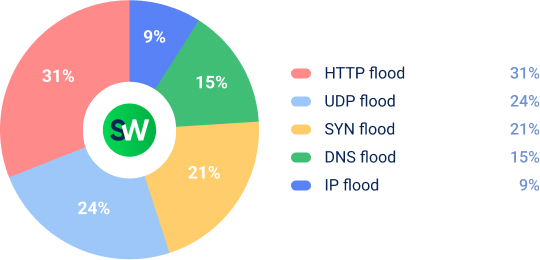
TCP-flood attacks were the dominant vector, representing more than one-third of all attacks, followed by UDP-floods and ICMP-floods.
Interestingly, attackers also began using several legacy or previously uncommon protocols again. These included: Teeworlds floods, RIPv1 floods, RDP floods, DemonBot floods, and VxWorks floods (up 71%).
Finance
Attacks on the financial sector accounted for 22% of all incidents in Q3, showing a 91% YoY increase. More than 63% of attacks in this vertical involved multiple vectors, and 37% used more than two vectors.
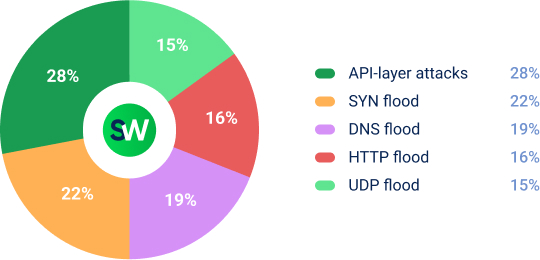
Most commonly, attackers targeted banking APIs and payment processing endpoints, as shown in the table above.
Retail
The retail sector saw attacks rise to 14% of all incidents in Q3, up from 9% in Q2—an 86% year-over-year increase. This growth is partly driven by the upcoming holiday shopping season and by a broader shift in the threat landscape from hacktivism to financially motivated attacks.
Attackers primarily targeted checkout pages, product listings, and payment systems, aiming to prevent customers from completing purchases.
These attacks hit both the network and the website at the same time, which is why they were so effective at taking retail services offline.
Where Were DDoS Attacks Concentrated?
Let’s break down how DDoS attacks were distributed by country in Q3 2025:
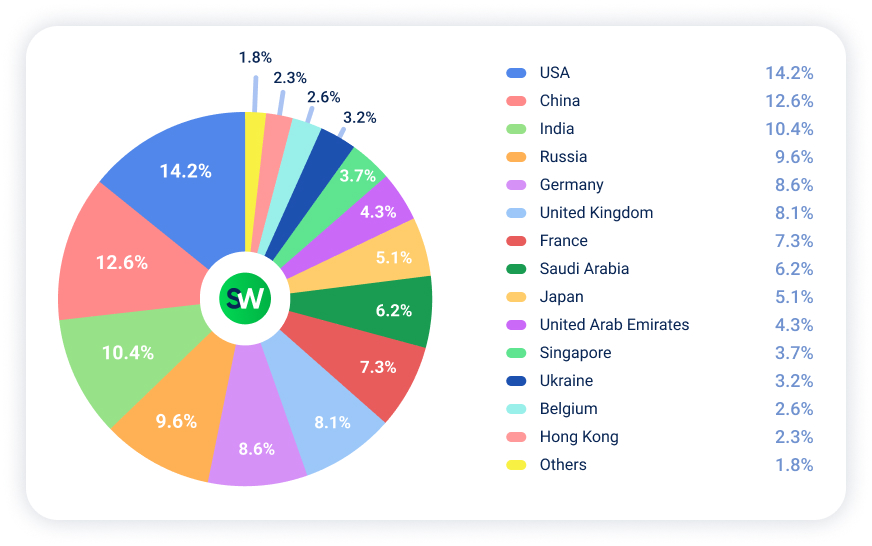
Looking at the three most attacked countries, the USA remained the most targeted one with 14.2% of attacks, up from 12.6% in Q2. China rose to 12.6% (up from 10.4% in Q2), while India held steady at 10.4% (versus 9.2% in Q2).
Together, USA, China, and India absorbed 37.2% of global DDoS traffic—this is up from 32.2% last quarter.
The most notable shift from Q2 to Q3 was the sharp decline in attacks on Israel and Iran. Both were among the top five targets in Q2, at 8.4% and 8.1% respectively, but dropped out of the top ten entirely in Q3. This aligns with the broader trend of fewer politically motivated attacks and a rise in those driven by profit.
Another trend we can see in Q3 is the rise in the volume of DDoS attacks targeting Eastern and Central Europe. In particular, attacks on Russia accounted for 9.6%, Germany 8.6%, the UK 8.1%, and France 7.3%.
Notable shifts from Q2 to Q3 include:
- USA (+): 12.6% → 14.2%
- China (+): 10.4% → 12.6%
- Russia (+): 6.4% → 9.6%
- Japan (+): 2.8% → 5.1%
- Germany (+): 7.6% → 8.6%
- UK (+): 7.3% → 8.1%
- Israel (–): 8.4% → dropped from top 10
- Iran (–): 8.1% → dropped from top 10
- France (+): 4.1% → 7.3%
- Belgium (–): 3.6% → 2.6%
Key Takeaways and Next Steps
As you can see, the threat landscape continues to evolve—with attackers’ motives and tactics shifting accordingly. One of the key Q3 insights is that some organizations still rely on defenses built for volumetric attacks, but these solutions are highly vulnerable to carpet bombing. The reason is simple—detection thresholds in such systems are set far above the actual per-IP traffic level. As a result, traditional DDoS protection won’t detect these attacks at all.
This is especially critical if your infrastructure powers essential services such as telecommunications, payment processing, or e-commerce. Ensure your DDoS protection uses intelligent traffic analysis—ideally ML or AI-based—to detect attacks and probing activity early, before they escalate into service-impacting outages.
Remember, the right security tools can turn these challenges into opportunities to strengthen your digital resilience and support your long-term growth!

DDoS Protection for Websites
- Activate protection in 10 minutes
- 24/7 technical support