
 +44 20 3695 6722
 Sign in
The Attack History section in StormWall for Networks and StormWall for Servers has been updated and expanded. Now called Attacks, the section makes it even easier to monitor DDoS attacks in real time, manage traffic filtering, and export reports. Here’s what’s changed.

1. Attacks on Subnets Are Grouped by /24 Prefix
We’ve introduced a more convenient way to group attacks by IP address. Here’s what’s changed:
- Previously, each attack targeting an individual IP address was listed as a separate event. When an entire network came under attack, the list could contain thousands of events.
- Now, all attacks targeting a subnet are grouped by the /24 prefix. This means that IP addresses in the range from x.x.x.0 to x.x.x.255 appear as a single group.
| Why It Makes a Difference When an entire subnet comes under attack, the first few minutes should be spent assessing the scale of the incident, not sorting through a long list of events. Grouping attacks makes it easier to see whether you’re dealing with an isolated issue or an attack targeting an entire network segment, helping you decide on the next steps faster. |
2. Overview of Active and Completed Attacks
The Attacks section has two tabs:
- Activity — DDoS attacks currently in progress.
- History — completed attacks.
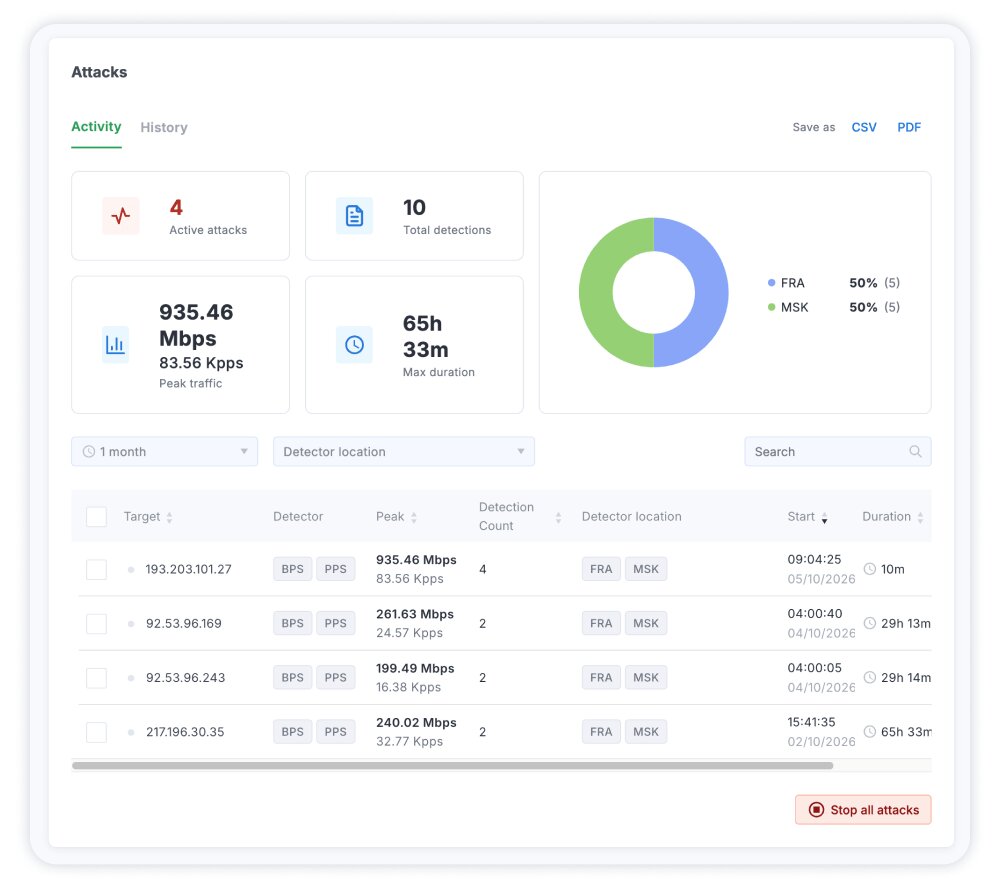
At the top of each tab, you’ll find a summary of key metrics, including:
- The total number of attacks and detections.
- Peak traffic rates in BPS and PPS.
- Maximum attack duration.
- Breakdown of detections by detector location.
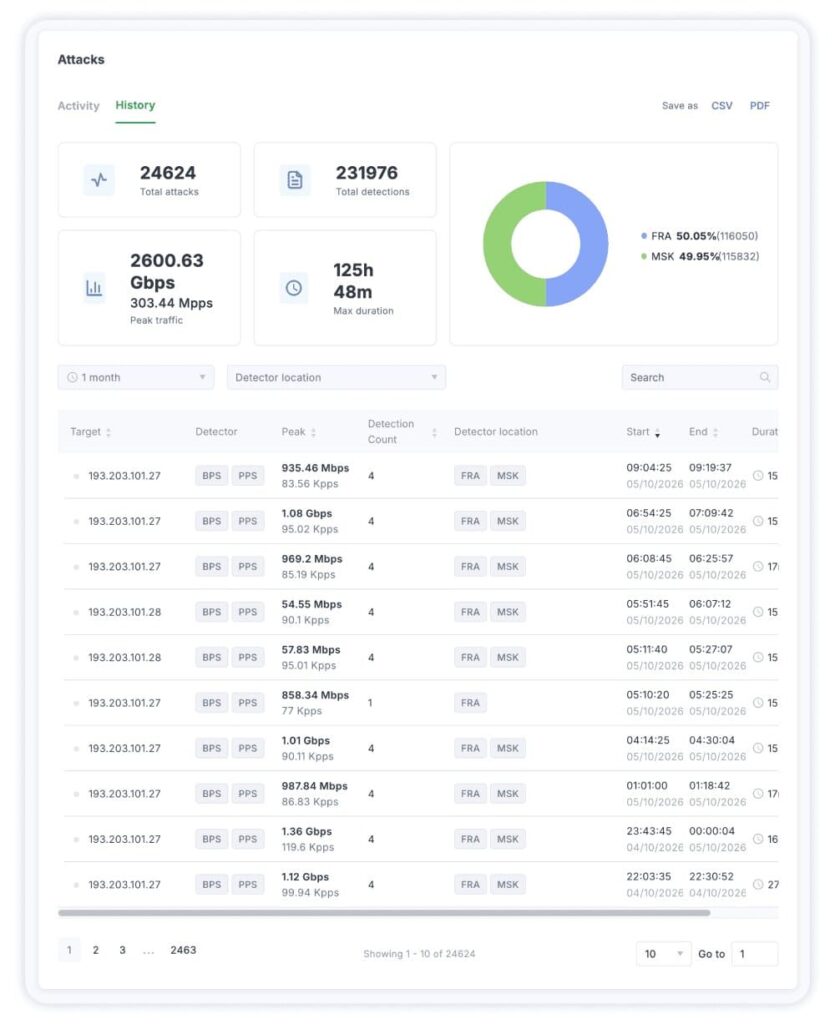
You can also search, sort, and filter attacks by location and time range.
| Why It Makes a Difference Imagine you need to quickly answer a colleague or manager asking, “What’s happening right now?” Instead of manually gathering information from multiple tabs, you can see key traffic metrics at a glance in a single view. |
3. Detailed Attack Information
Click any attack to view:
- Traffic charts showing BPS and PPS.
- Peak attack rates, number of detections, and status.
- A detection summary showing what was affected, which rule was triggered, and where and when it happened.
- Traffic details, including top IP addresses, protocols, and other parameters.
Need more detail? Expand a detection entry to see which rules were triggered.
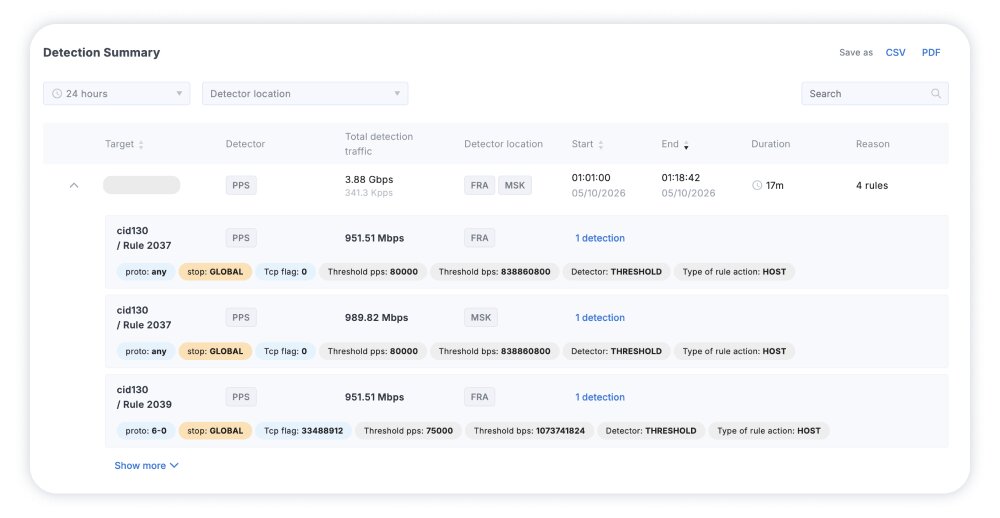
| Why It Makes a Difference When a detection is triggered, one of the first questions is usually, “Why did this happen?” You can now more quickly identify the traffic characteristics that triggered a detection and assess how effectively your current rules are working. |
4. Manage Traffic Filtering During an Attack
You can control traffic filtering in two ways:
- Stop all — disable traffic filtering completely using the button below the list.
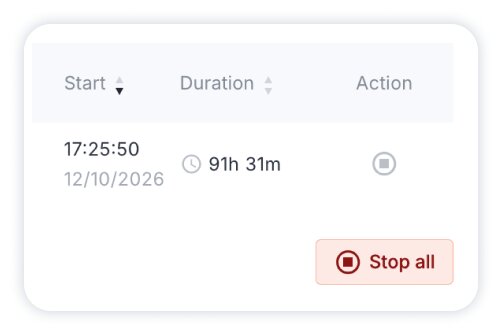
- Disable an individual rule without affecting the remaining rules.
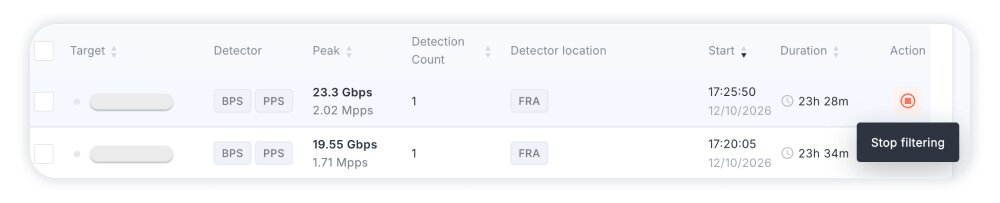
Once an attack has ended, you can review its details in the History tab.
| Why It Makes a Difference Suppose traffic patterns change during an attack and one of the detection rules starts triggering false positives. You can disable that rule for the current attack while detection based on the remaining rules continues to work. |
5. Attack Reports in Two Formats
You can now export attack data in CSV format. We’ve also improved PDF reports by adding attack charts and more detailed information.
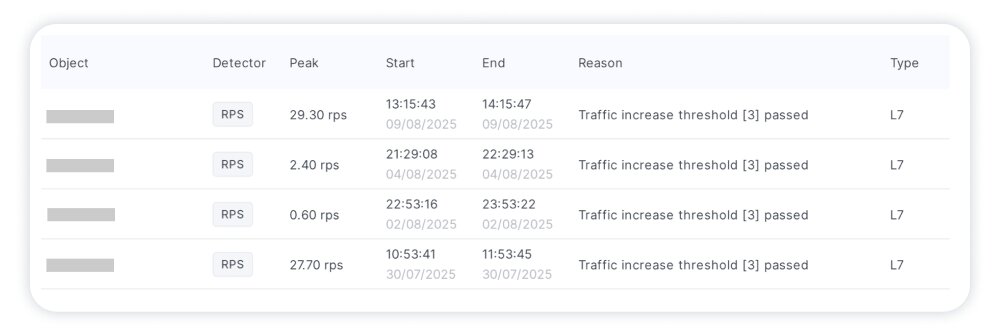
An attack in the previous report format
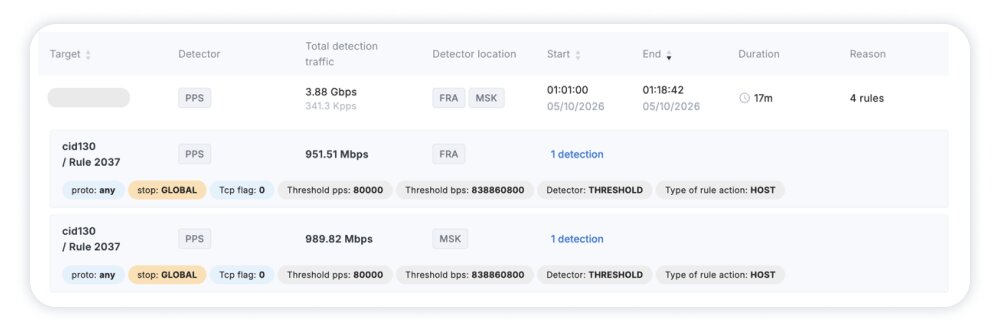
The same attack report after the update
| Why It Makes a Difference Work doesn’t stop when a DDoS attack ends. You still need to explain what happened to colleagues and management, assess the scale and impact of the incident, and determine the next steps. With the updated reports, you can support your conclusions with charts and detailed metrics instead of relying on subjective assessments — and make an evidence-based case for changes to your protection setup. |
Less time on routine tasks. More control over your protection. Get structured DDoS attacks data and manage traffic filtering with greater ease.
For more information about the Attacks section, see our user guide.

Network Protection from DDoS Attacks
- Activate protection within 10 minutes
- 24/7 technical support
