


The number of DDoS attacks worldwide in H1 2025 rose by 83% compared to H1 2024. Which industries and countries were most affected? Learn more in our report.
H1 2025 Main Trends
The main factor driving the growth of DDoS attacks has once again been the geopolitical situation, which we’ll discuss later. But first, let’s look at the key trends in the evolution of attacker technologies.
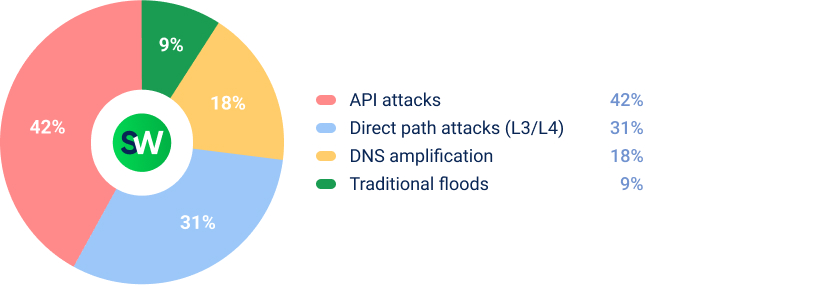
API Attacks Up 63% Year-Over-Year
API attacks target web services by sending thousands of legitimate-looking HTTP/HTTPS requests to overload systems. Unlike traditional DDoS attacks that flood networks with massive traffic volumes, API attacks use far less bandwidth but can cause far greater disruption.
In the first half of 2025, the nature of these attacks changed significantly. During Q1, about 70% of HTTP DDoS attacks originated from botnets—networks of compromised devices controlled by attackers. By Q2, that figure had risen to 81%.
As the year progressed, attacks became smaller yet more precise. Early in the year, the average attack volume ranged from 10,000–30,000 RPS, peaking at 50,000 RPS. By Q2, it dropped to 6,000–8,000 RPS or less. Despite being smaller, those attacks were more destructive, exploiting specific API vulnerabilities rather than overwhelming entire networks.
The result: API attacks caused outages lasting 4.2 times longer than traditional network-layer attacks while using 90% less traffic.
Probing Attacks Surge 428%
The number of probing attacks spiked by 428% compared to the same period last year. These attacks involve sending small bursts of traffic to probe a target’s defenses and identify vulnerabilities before launching a full-scale assault.
In Q2, 92% of major DDoS attacks targeting government infrastructure were preceded by such probing activity.
Organizations with outdated DDoS protection were six times more likely to suffer a successful breach after being probed. Attackers typically spent one to two days analyzing how to bypass defenses—and then struck precisely at the weak points they had discovered.
Growing Botnets
In H1 2025, the average botnet consisted of around 90,000 devices. By the end of Q2, that number had grown to 150,000—a nearly 70% increase in just three months. These massive botnets are capable of launching extremely powerful attacks ranging from 100 to 500 Gbps, enough to overwhelm many standard DDoS protection systems.
The United States recorded the highest number of compromised devices, with a 137% increase compared to last year. Russia saw a 32% rise, while Turkey entered the top three countries for botnet activity for the first time.
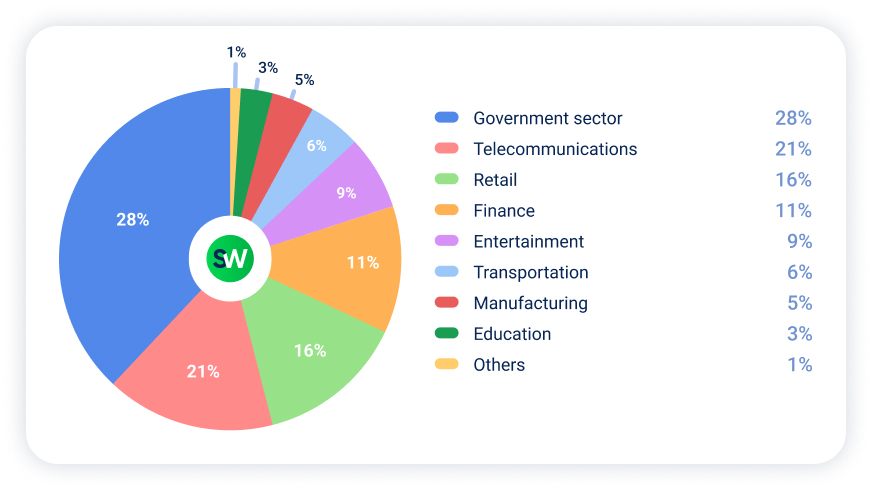
Attacks by Industry
Now, let’s look at how DDoS attacks were distributed across industries in H1 2025:
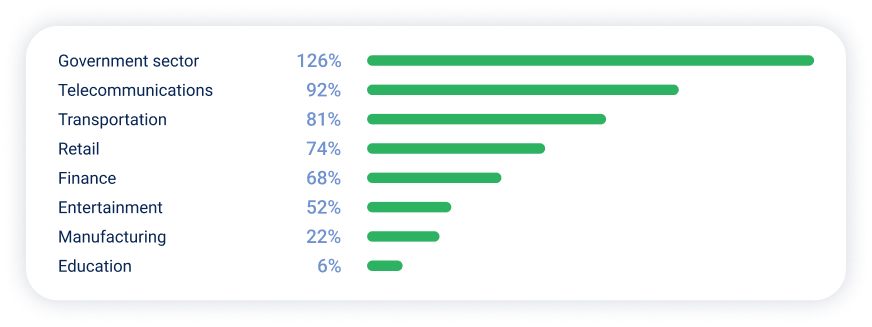
And here is a list of the industries that experienced the highest year-over-year growth in DDoS attacks in the first half of 2025:
Here are the most important changes from H2 2024:
- Government sector remained the most targeted sector, accounting for 28% of all DDoS traffic.
- Telecommunications ranked second, with its share of attacks nearly doubling— from 11% in H2 2024 to 21% in H1 2025.
- Retail faced growing pressure, increasing to 16% of total attacks, up from just 7% the previous year.
- Finance saw its share fall slightly to 11% from 14% in H2 2024.
- Entertainment experienced the biggest shift, dropping to 9% of all attacks from 16% in H1 2024. Despite this decline in share, the absolute number of attacks grew by 52%.
Who Is Most at Risk of a DDoS Attack?
The table below shows the relative likelihood of DDoS attacks by sector, based on data from the first half of 2025.
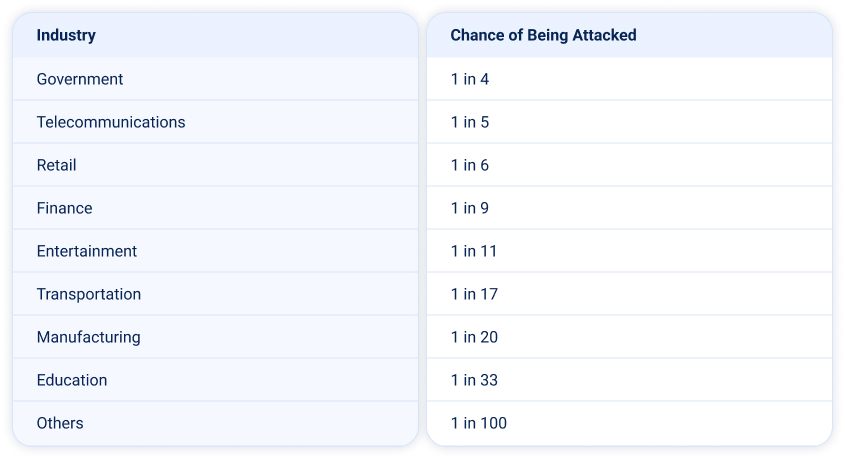
Note: This is a relative risk assessment based on the observed distribution of attacks in H1 2025. Actual risk levels may vary depending on each organization’s exposure surface, security posture, and the interest or motivation of threat actors.
Now, let’s break down the top-3 most attacked verticals in more detail:
Government Sector
Government was the most targeted vertical in H1 2025. Attacks primarily targeted public-facing services:

National government websites were hit most frequently—especially during periods of heightened political tension between countries. Municipal and local services were also heavily affected, often becoming secondary targets in carpet bombing campaigns designed to disrupt entire government networks.
Here are the main methods attackers used against government systems in the first half of 2025:
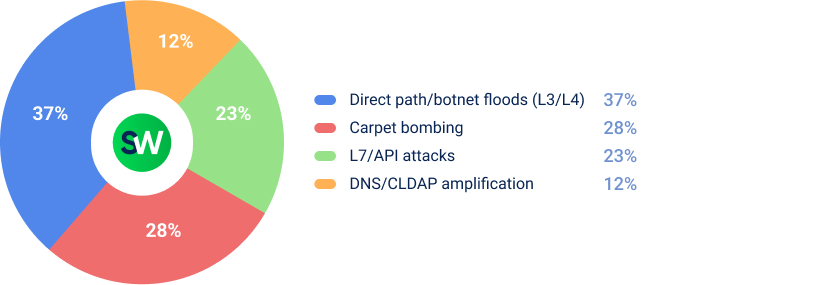
Direct-path attacks from botnets were the most common method, exploiting the surge in botnet capacity observed throughout the first half of the year.
Telecommunications
The telecommunications sector became the second most targeted industry in the first half of 2025. The chart below illustrates how attacks were distributed across various types of services in this sector:
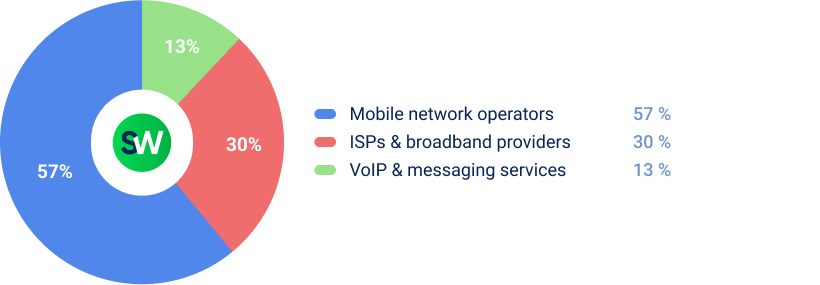
Most attacks targeted mobile network operators, as their infrastructure supports critical communications for millions of users.
The most common methods used against telecommunications infrastructure in H1 2025 included:
The most effective method against telecom infrastructure was carpet bombing—attackers targeted multiple IP ranges simultaneously, exploiting the decentralized nature of telecom networks.
Retail
In H1 2025, retail operations became the third most targeted industry. Retail experienced fluctuations in attack volume, with significant spikes during key shopping periods.
During the Ramadan sale period (February 14–March 16) in the MENA region, attacks surged by over 300% in some countries. Mid-sized online stores were hardest hit, lacking the robust security systems of larger e-commerce platforms.
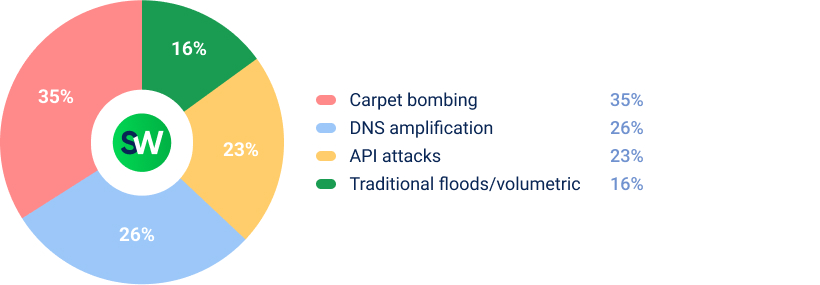
Attack methods focused heavily on disrupting customer transactions:
API attacks were the most common type of DDoS activity in the retail sector. Threat actors focused on login pages, checkout systems, and payment gateways, exploiting these critical points to disrupt operations. Such incidents were often leveraged for extortion, particularly during peak shopping periods, when downtime could lead to substantial financial losses.
DDoS Attacks by Country
Let’s break down how DDoS attacks were distributed by country in H1 2025:
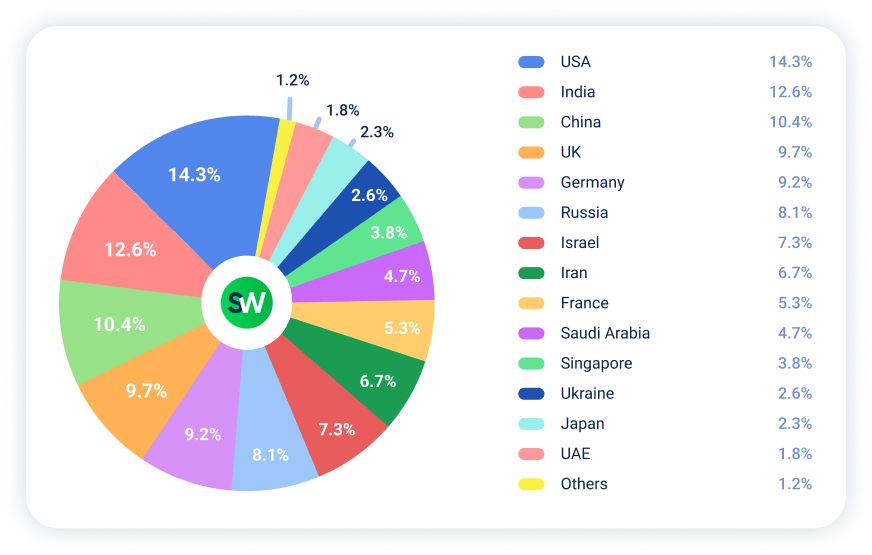
The United States was the most targeted country in H1 2025, representing 14.3% of all global DDoS attacks, up from 12.8% in H2 2024. India ranked second with 12.6%, up from 9.2%, marking a 37% relative increase. China placed third, receiving 10.4% of attacks, down from 11.3% in the previous period.
The United Kingdom also saw growth, with its share increasing to 9.7% from 8.3%, while Germany remained relatively stable at 9.2%, compared to 8.7% in H2 2024.
The biggest changes occurred among countries involved in armed conflicts. Russia’s share of cyberattacks rose from 6.8% to 8.1%—a 19% increase, primarily driven by hacktivist activity.
Israel also experienced a sharp rise in outbound attack activity, from 2.6% in H2 2024 to 7.3% in H1 2025, coinciding with escalating regional tensions. Meanwhile, Iran became the sixth most targeted country, with 6.7% of total attacks attributed to groups supporting Israel.
Other notable shifts in H1 2025 include:
- France (–): 10.4% → 5.3%
- Saudi Arabia (new): 4.7%
- Singapore (new): 3.8%
- Ukraine (new): 2.6%
- Japan (new): 2.3%
- UAE (–): 6.1% → 1.8%
Quick Highlights
In H1 2025, precision-targeted attacks are increasingly replacing volumetric ones, rendering defenses that rely solely on bandwidth less effective. While many organizations prepare to mitigate the next terabit-scale flood, threat actors focus on mapping API endpoints through probing. Strategies that worked in 2024 will no longer suffice in 2025.
If you realize that your organization needs a new level of protection against these and other emerging threats, we’re here to help. Contact us today!

DDoS Protection for Websites
- Activate protection in 10 minutes
- 24/7 technical support